Image Recognition
A brief overview of CoolR's image-recognition capabilities, accuracy, and common business applications.
Product Setup Requirements
What information is required for SKU setup?
- Minimum 5 megapixel images of product packaging from all angles.
- For cylindrical products:
- 3–4 images around the circumference.
- 1–2 images from the top.
- Complete packaging information including branding and colour for accurate visual representation.
Planogram Management
How many planograms are typically needed?
Typically a market requires only a small number of planograms. Planograms are defined by combinations of:
- Market.
- Channel.
- Classification.
- Equipment type.
For example, a market may have different planograms for:
- Highway-adjacent stores.
- City-centre locations.
What information is needed for planogram setup?
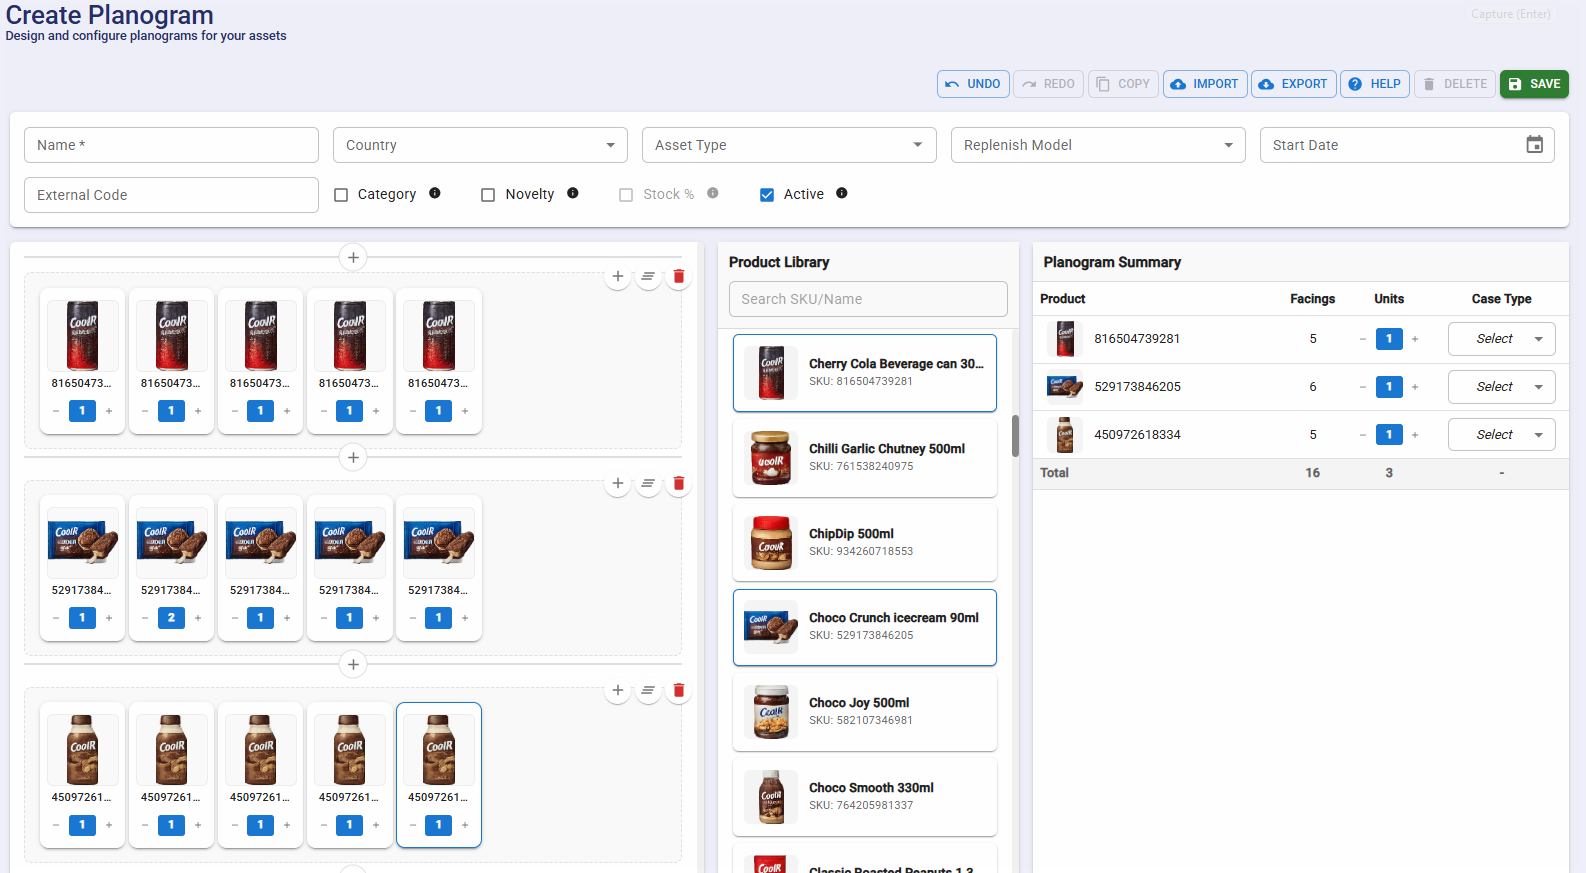
To create a planogram you need:
- Complete product setup.
- Shelf specifications.
- Asset-type details (if the planogram is specific to certain cooler/freezer models).
Who can manage planograms?
Any user with planogram modification privileges can:
- Create new planograms.
- Assign planograms to assets.
Priorogram System
What is a priorogram?
The Priorogram is CoolR's proprietary approach to handling "missed opportunities" and "order recommendations" for out-of-stock situations. It addresses common challenges with traditional planograms:
- Traditional planograms can be time-consuming to set up.
- Field implementation often deviates from the defined planogram due to practical constraints.
The Priorogram model allows customers to:
- Specify SKUs in order of priority.
- Focus on product availability rather than fixed positioning.
- Receive recommendations based on the priority list and current inventory.
Stock Calculation Methods
How is stock calculated across different tiers?
Basic Tier / Navigator
- Uses Share of Shelf (SoS) or Share of Visible Inventory (SOVI).
- Common approach among traditional image-based monitoring solutions.
Commander and Pioneer Tiers
- Utilizes depth estimation for stock calculation.
- Stock levels are approximated in 25% increments (25%, 50%, 75%, 100%).
- Camera positioning affects measurement:
- Horizontal freezers: top-mounted camera provides accurate stock-level assessment.
- Vertical freezers: front-mounted camera measures stock via product distance from the shelf front.
How accurate is stock calculation?
- Approximately 95% accurate across 30,000+ units.
- Successfully used for order recommendations across various businesses.
- Proven track record of 30%+ sales uplift in the first year when recommendations are followed.
Can exact stock counts be obtained?
While CoolR's solution prioritizes cost-effectiveness and quick ROI with 95%+ accuracy, alternative solutions for exact counting include:
- Grab-and-go systems.
- Point-of-sale integrations (Just Check Out).
- Weight sensors.
- RFID technology.
Key Metrics and Calculations
What are the key performance metrics?
Stock (SOVI — Share of Visible Inventory)
- Used to identify replenishment schedules and product sale patterns at SKU level.
Planogram / Priorogram Compliance
- Measures product portfolio effectiveness, SKU-level placement efficiency, out-of-stock situations, and product distribution.
Purity
- Measures the percentage of the asset occupied by the customer's own products.
- Also known as Share of Own Inventory.
- Used for trade-terms compliance monitoring.
How are metrics calculated?
Standard calculations include:
Stock % = (Total Visible Products - Foreign Products) / Total Available Positions
Purity = (Total Visible Products - Foreign Products) / Total Visible Products
Planogram Compliance = (Total Planogram Facings - Compliant Facings) / Total Available Positions
Note: Total Available Positions is determined by either:
- Defined planogram occupied spaces, or
- (Shelves × Columns per shelf) as specified in the Asset Type configuration.
Image Recognition Process
What is CoolR's image-recognition workflow?
-
Image processing
- Stitching of fragmented images.
- Human-feature obfuscation.
- Area-of-interest cropping.
- Perspective correction (fish-eye reduction).
- Quality adjustment (brightness, contrast).
-
Detection steps
- Shelf/basket identification.
- Product-shape detection.
- Empty-space recognition.
- SKU identification.
- Stacking analysis.
- Stock-level assessment.
What is the accuracy level and how is it maintained?
- 95%+ accuracy in automated recognition.
- Verification process:
- Random 20% of images undergo human review.
- Minimum 10 SKUs per test set.
- Regular benchmarking across 1,000 images.
- Diverse location and asset sampling.
Accuracy may vary in the following field scenarios
While the system maintains 95%+ automated recognition accuracy, certain real-world freezer and shelf conditions can make SKU detection more challenging.
Similar-looking products (different SKUs, similar packshots)
Some SKUs have nearly identical packaging design, colours, and branding. When visual differences are minimal, repeated training examples are required for reliable differentiation.
Same flavour, different size (minute size variation)
Products of the same flavour but slightly different sizes represent different SKUs. When size variations are very small, distinguishing them from typical camera distances becomes difficult without contextual learning.
Products placed at the extreme edges of large freezers
Items placed at the far left or right edges are often captured at oblique angles, partially visible, or distorted due to lens perspective and reflections from freezer glass.
Non-ideal product placement
Products may be tilted, stacked, pushed back, or partially hidden behind other SKUs, reducing clear visibility for detection.
Field image quality challenges
Lighting variations, glare, condensation, motion blur, and reflections can impact image clarity and recognition performance.
Continuous model training with real-world images ensures that accuracy remains consistently high across assets and markets.
Why is continuous training necessary?
Image recognition requires ongoing training to handle:
- Seasonal packaging changes.
- New product variants.
- Similar-product differentiation.
- Image-quality variations.
- Product-placement variations.
The system must continuously learn to:
- Distinguish similar products.
- Recognize new packaging designs.
- Adapt to different viewing angles.
- Handle varying light conditions.
- Process multiple product variations.
Business Applications
What are the key use cases for this data?
- Inventory optimization:
- Improved on-shelf availability.
- Portfolio optimization.
- Merchandising management:
- Standards monitoring and enforcement.
- Cost and carbon-footprint reduction.
- Compliance:
- Trade-terms enforcement.
- Unbiased continuous monitoring.
- Business optimization:
- Missed-opportunity identification.
- Delivery-routing optimization.