Business Performance
KPIs Overview
- Merchandising: Insights into the merchandising quality and fill-level of your assets.
- Portfolio: Understand how your products are being distributed.
- Sales & Shopper: Understand the sales performance of your assets.
KPIs, we can segment the data based on various categories, including Market, Classification, Channel, Distributor, and Primary Sales Rep.
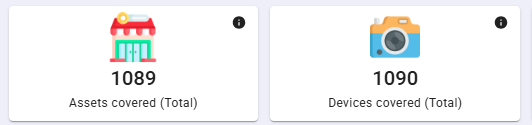
These KPIs are calculated based on the number of assets that have sent data over the time period selected.
Merchandising KPIs
We offer the flexibility to break down the data over any required time period, such as monthly or quarterly.
Two KPIs can be graphed and compaired
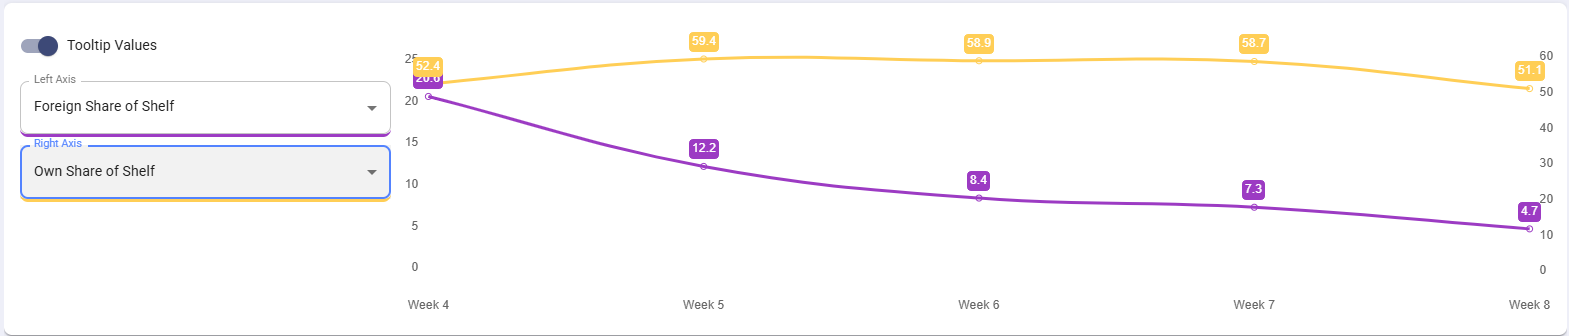
Trends can also be analyzed over the selected time period.
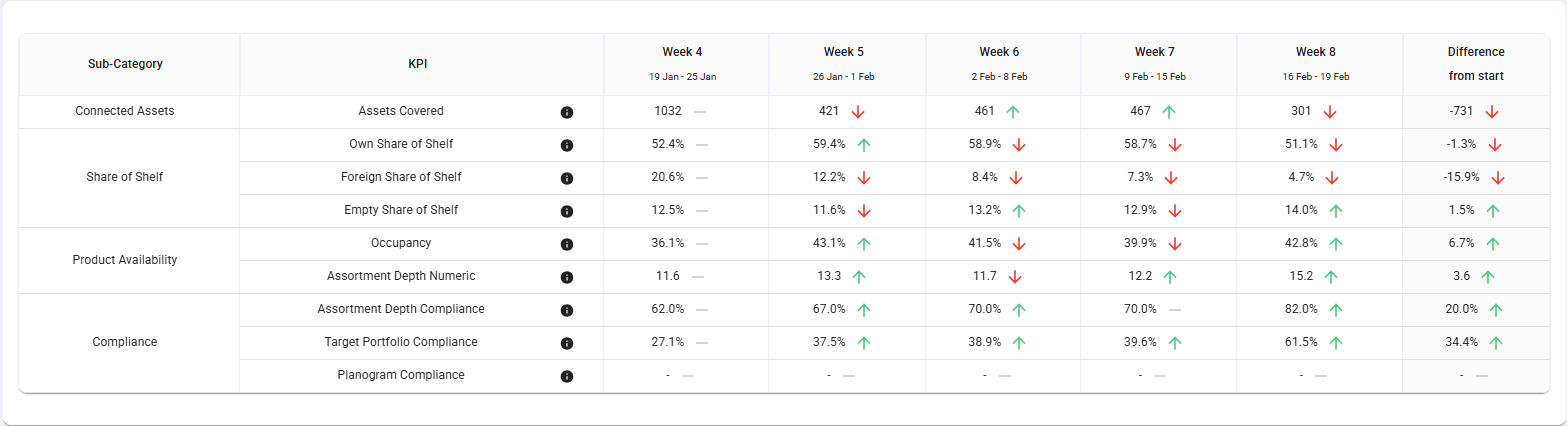
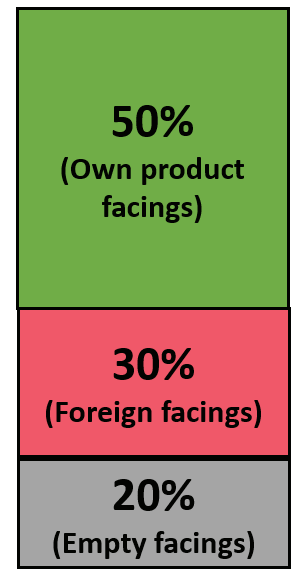
Share of Shelf
- Own Share of Shelf: What is the share of shelf my products take?
(Own Product Facings / Total Facings) × 100
- Foreign Share of Shelf: What is the share of shelf that foreign products take?
(Foreign Product Facings / Total Facings) × 100
- Empty Share of Shelf: What is the share of shelf that remains unused?
(Empty Facings / Total Facings) × 100
Example Calculation:
- Total Facings: 10
- Own Product: 5 facings (50%)
- Foreign Product: 3 facings (30%)
- Empty Slots: 2 facings (20%)
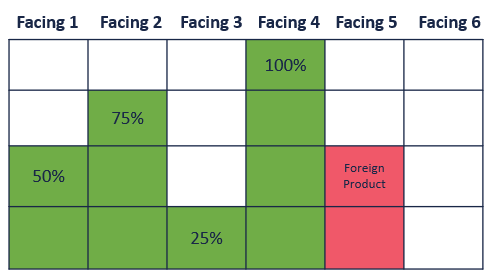
Occupancy
- Definition: Combines "Own Share of Shelf" and "Fill Level Percentage" of own products.
- Formula:
(Sum of Fill Level Percentages for Own Facings) / (Total Capacity)
Example:
- Here, Facing 1 to 4 has own product facings with fill level of 50%, 75%, 25% and 100% respectively.
- Facing 5 has Foreign product and Facing 6 is empty facings
- Foreign & Empty Facings are excluded
- Result:
(50 + 75 + 25 + 100) / 600 = 41.67%
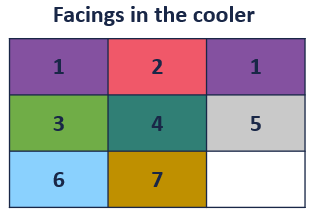
Assortment Depth Numeric
- Definition: Total count of unique (own) products recognized in the cooler. Duplicate facings count as one.
Example:
- Cooler has 9 facings, with 8 products, 1 of the products has 2 facings.
- Assortment Depth Numeric: 7 unique products.
Assortment Depth Compliance
- Definition: Comparison of "Assortment Depth Numeric" to "Planogram Targeted Unique Products".
- Formula:
(Assortment Depth Numeric / Target Unique Planogram Products) × 100
Example:
- Assortment Depth Numeric: 7
- Planogram Target Products: 9
- Result:
(7 / 9) × 100 = 77.78%
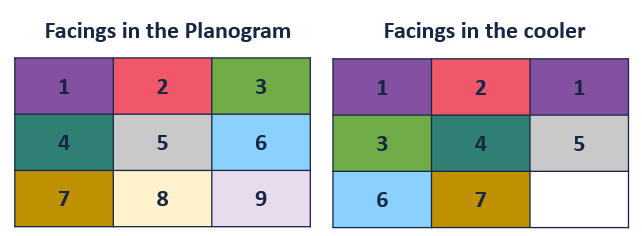
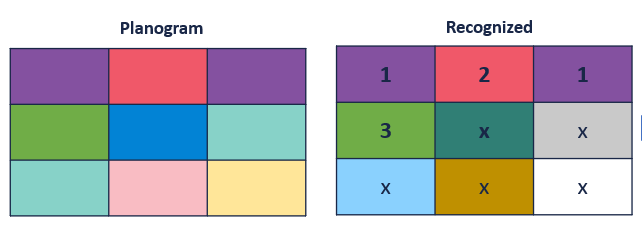
Target Portfolio Compliance
- Definition: Percentage of unique products recognized that are in the planogram.
- Formula:
(Recognized Unique Products in Planogram / Total Unique Planogram Products) × 100
Example:
- Planogram Unique Products: 7
- Recognized Products: 3
- Result:
(3 / 7) × 100 = 42.85%
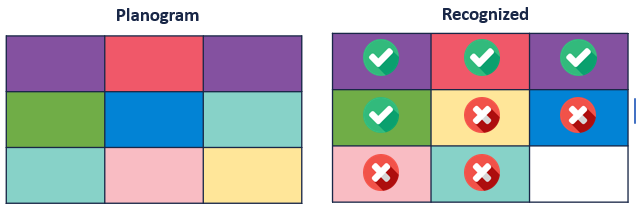
Planogram Compliance
- Definition: Percentage of products positioned correctly as per the planogram.
- Formula:
(Correctly Positioned Facings / Total Recognised Facings as Per PoG) × 100
Example:
- Correct Positions: 4
- Total Facings: 9
- Result:
(4 / 9) × 100 = 44.44%
Portfolio KPIs
Product Distribution
-
Definition: For every product, it is the numeric distribution of the product over all the assets distributed by day.
-
Formula:
Average Per Day(Assets with Product / Total Assets)
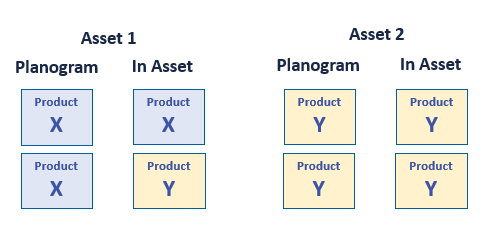
Product Distribution Compliance
-
Definition: For every product, it is the distribution level within those targeted assets for which that product is present in the planogram.
-
Formula:
Average Per Day(Planogram and Store / Total Planogram Assets)
Example 1:
Product X:
-
Product Distribution:
- X is present only in Asset 1 out of 2 total assets.
- Result:
(1 / 2) x 100 = 50%
-
Product Distribution Compliance:
- Only Asset 1 has product X in the planogram. Product X is present in Asset 1.
- Result:
(1 / 1) x 100 = 100%
Product Y:
-
Product Distribution:
- Y is present in both assets (1 and 2).
- Result:
(2 / 2) x 100 = 100%
-
Product Distribution Compliance:
- Both assets have product Y in their planogram. Product Y is present in both assets (1 and 2).
- Result:
(2 / 2) x 100 = 100%
Sales & Shopper KPIs
Average Suggested Order Value
- Definition: Average value of suggested orders in a selected time period.
- Formula:
(Total Suggested Orders' Values) / (Total Number of Suggested Orders)
Example:
- Suggested Orders Value over 3 days: $10, $20, $25
- Result:
(10 + 20 + 25) / 3 = $18.33
Average Suggested Order Cases
- Definition: Average number of cases in suggested orders during a selected time.
- Formula:
(Total Suggested Orders' Cases) / (Total Number of Orders)
Example:
- Suggested Cases over 3 days: 8, 10, 6
- Result:
(8 + 10 + 6) / 3 = 8 Cases
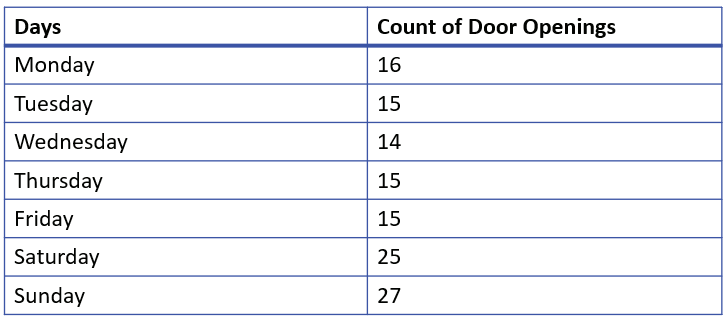
Door Openings
- Definition: Average daily door openings per asset in a selected time. (Applies to verticals only)
- Formula:
(Total Door Openings) / (Number of Days)
Example:
- Total Openings: 127 over 7 days.
- Result:
127 / 7 = 18.14