
Appearance
Dashboard: track survey activity and coverage
The Operational Dashboard shows how surveys are progressing in the field: how many submissions there are, which outlets have been covered and which remain, and which users and outlets are most and least active. Use it to see whether a survey will reach its outlets before it ends, and where to push the field team.
Who uses it: managers and supervisors. Where: StoreBuddy › Dashboard.
The numbers in the table match the illustration.
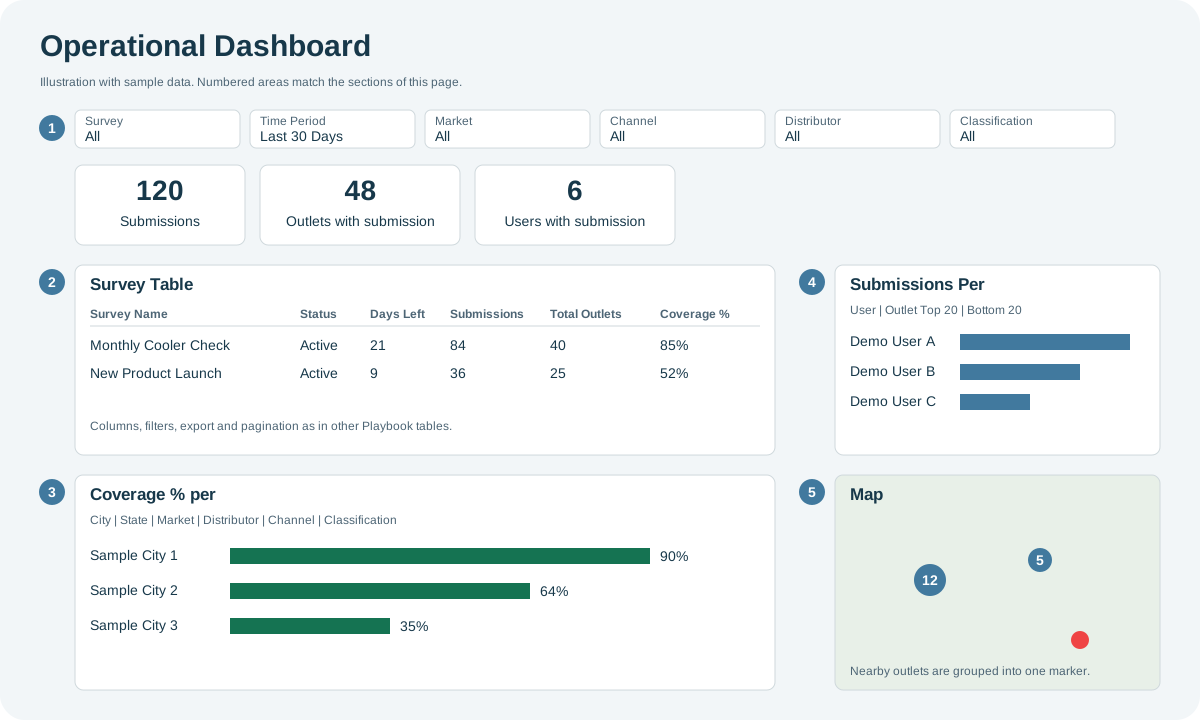
| Area | What it shows |
|---|---|
| 1. Filters and cards | Survey (all by default; choose surveys, then Apply), Time Period (default Last 30 Days; also Last 7/14/90 Days, Last Year, Week/Month/Quarter/Year to Date or Custom), and Market, Channel, Distributor and Classification (default All). The cards count unique Submissions, Outlets with submission and Users with submission. |
| 2. Survey Table | Per survey: color, status, days left, submissions, total, covered and remaining outlets, average submissions per outlet, and coverage %. Covered outlets are outlets with at least one submission. |
| 3. Coverage % per | Coverage grouped by City, State, Market, Distributor, Channel or Classification, with its own survey selector. |
| 4. Submissions Per | Submissions by User or Outlet, as Top 20 or Bottom 20. |
| 5. Map | Outlets with submissions. Nearby outlets are grouped into one marker; select it for details. |
Typical uses
- Will the survey finish on time? Compare days left with remaining outlets in the Survey Table.
- Where is coverage low? Use Coverage % per by market, distributor or channel.
- Who needs follow-up? Switch Submissions Per to User and Bottom 20.
To see what was answered, open a submission in the Inbox or analyze a survey in Result Analysis.