
Appearance
Result Analysis: chart and export survey answers
Result Analysis brings all the answers to one survey together, question by question, with a chart for each. Filter by date, market, channel, classification or outlet to compare parts of the field, and export the results. Photo questions with image analytics turned on also show their image recognition KPIs here.
Who uses it: managers, category and trade marketing teams. Where: StoreBuddy › Results Analysis. Find the survey in the list (sorted by name) and select its name.
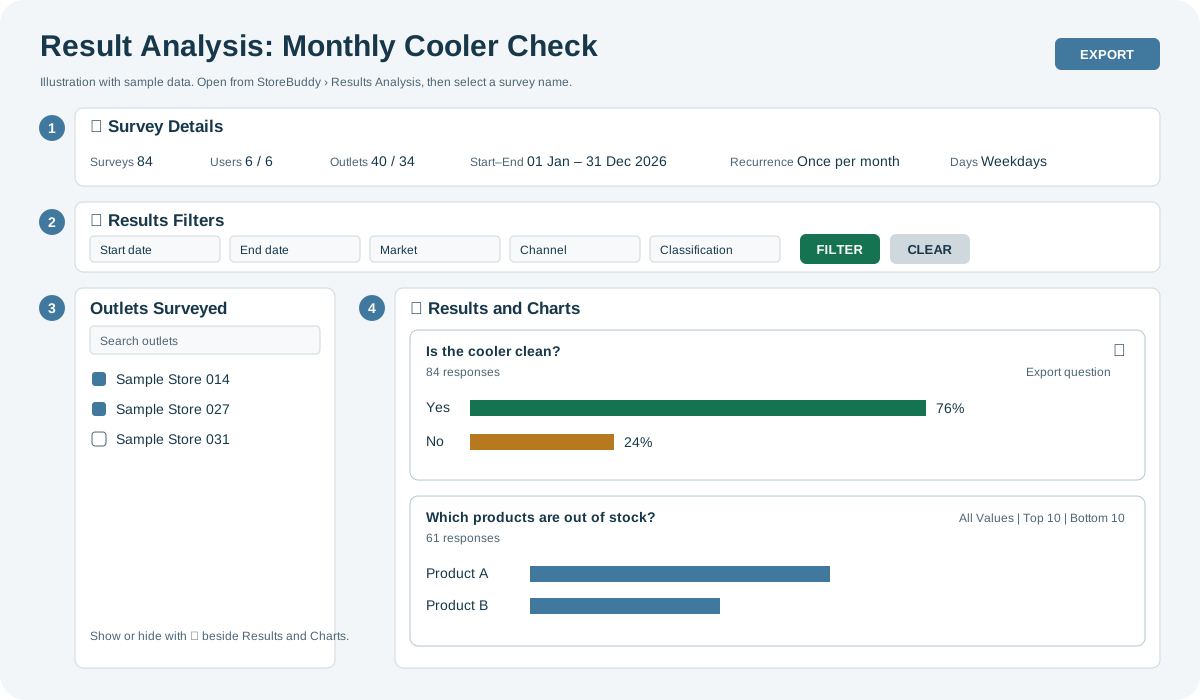
| Area | Use it to |
|---|---|
| 1. Survey Details | See surveys submitted to date, users and outlets included versus surveyed, start–end dates, recurrence and the days the survey is available. |
| 2. Results Filters | Filter by start date, end date, market, channel and classification, then select Filter. Clear removes the filters. |
| 3. Outlets Surveyed | Search and select outlets. Show or hide the panel with ☰ beside Results and Charts. |
| 4. Results and Charts | Read each question's response count and chart. The chart type follows the answer type; some offer All Values, Top 10 and Bottom 10. |
Export
Use Export for the whole analysis, or the ⋮ menu on a question card for that question only.
If nothing appears, widen the dates or clear the filters. To read a single submission in full, use the Inbox.