
Appearance
Merchandising: Progress Report and Asset Drill Down
Merchandising measures the merchandising quality and fill level of your coolers from their images: how much shelf space your products take, how full they are, and how closely coolers follow their planogram. It has two tabs: Progress Report for trends and Asset Drill Down to find the outlets and coolers behind a result.
Merchandising at a glance
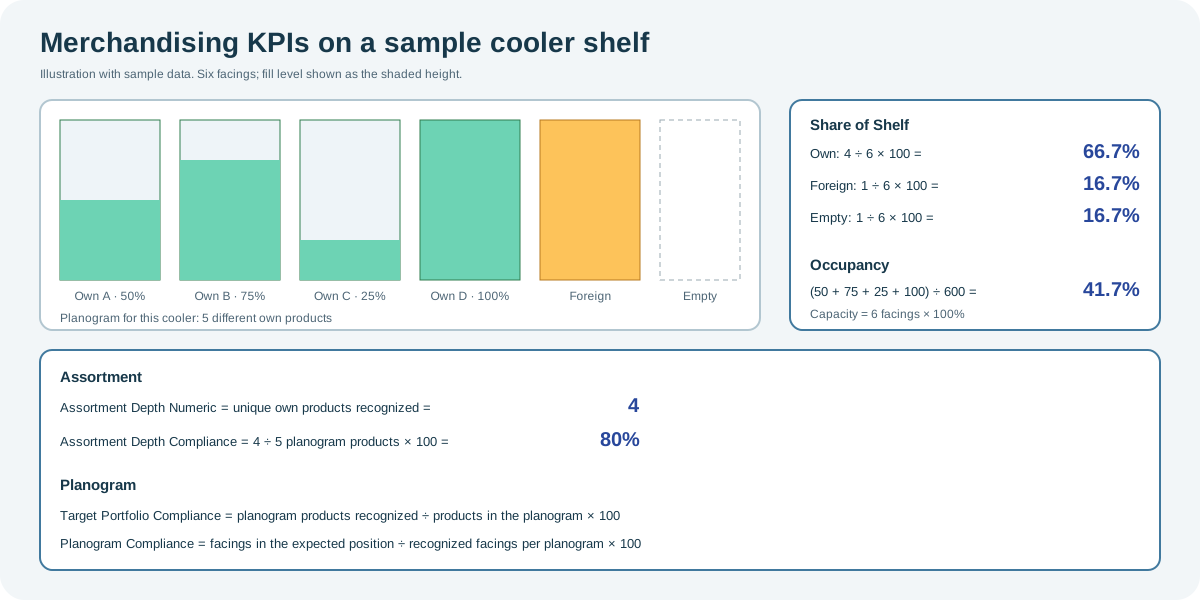
Open the full-size Merchandising KPI diagram.
When to use it
- Progress Report: see whether merchandising KPIs improve week by week, month by month or quarter by quarter, and compare markets, channels or sales reps.
- Asset Drill Down: find the groups, outlets and coolers with the lowest results for a date range, and open their images.
Who uses it
| Role | Typical use |
|---|---|
| Category and trade marketing managers | Track share of shelf and planogram compliance over time. |
| Sales managers and field teams | Find outlets and coolers to fix on the next visit. |
Where to find it
Select Business Performance > Merchandising Progress Report or Merchandising Asset Drill Down. Both open this page; switch between them with the PROGRESS REPORT and ASSET DRILL DOWN tabs. The filter panel and cards are described on the Business Performance overview.
KPIs
The KPIs listed depend on your organization's setup. The most common are:
| KPI | Meaning | Formula |
|---|---|---|
| Own Share of Shelf | Share of facings taken by your products. | Own facings ÷ total facings × 100 |
| Foreign Share of Shelf | Share of facings taken by other companies' products. | Foreign facings ÷ total facings × 100 |
| Empty Share of Shelf | Share of facings left empty. | Empty facings ÷ total facings × 100 |
| Occupancy | Share of shelf and fill level of your products, combined. | Sum of fill levels of own facings ÷ total capacity |
| Assortment Depth Numeric | Number of different own products recognized. A product with several facings counts once. | Count of unique own products |
| Assortment Depth Compliance | Assortment depth compared with the planogram. | Assortment Depth Numeric ÷ unique products in the planogram × 100 |
| Target Portfolio Compliance | Share of the planogram's products that were recognized. | Recognized planogram products ÷ unique planogram products × 100 |
| Planogram Compliance | Share of facings in the position the planogram expects. | Correctly positioned facings ÷ recognized facings per planogram × 100 |
Using the screen
Progress Report
- In KPI, choose All KPI or one KPI.
- In Period, choose Week, Month or Quarter. In Last, choose how many periods to show (2 or 4).
- With one KPI selected, choose Group by: Market, Classification, Channel, Sales Rep, Client, Distributor or Key Account.
The chart shows the trend. With All KPI, choose one KPI for the Left Axis and another for the Right Axis to compare them. Turn on the values switch to show the numbers on the chart. The table below lists each KPI, or each group, for every period.
Use Export in the filter panel to download the Progress Report.
Asset Drill Down
- Choose the KPI, Group by and Date Range, for example Last 7 Days, or Custom with a start and end date.
- The table summarizes the KPIs for the date range. To drill down, double-click a value, or open the menu next to a KPI and choose Market, Classification, Channel or Sales Rep.
- Each level opens below the previous one. Double-click a row to go one level deeper. The levels are:
- the groups, for example each market;
- the outlets in that group, with Outlet, Outlet Code, Address, City and State;
- the coolers at that outlet (Asset Serial #);
- the outlet card for that cooler, on its Assets tab, with its images.
- Close a level with X.
With one KPI selected, the drill-down starts at the outlets, and Export downloads the table.
Why you might not see something
- A KPI is missing from the list: it is not set up for your organization.
- Group by is unavailable in Progress Report: select a single KPI first.
- "Unable to get KPI list": the KPI setup did not load. Select Retry.
Tips
- Put Own Share of Shelf and Planogram Compliance on the two axes to see whether more space also means better execution.
- In Asset Drill Down, group by Sales Rep to plan follow-up with each rep.
Related pages
Last updated: November 12, 2026. Screens and options vary with your role and your organization's setup.