
Appearance
Sales: history of scheduled orders
The Sales screen shows the orders scheduled for fulfillment: how many there were, what they were worth and how that changes over time. An order counts as a sale when it moves to Scheduled in Reorder. The screen is read-only.
Sales at a glance
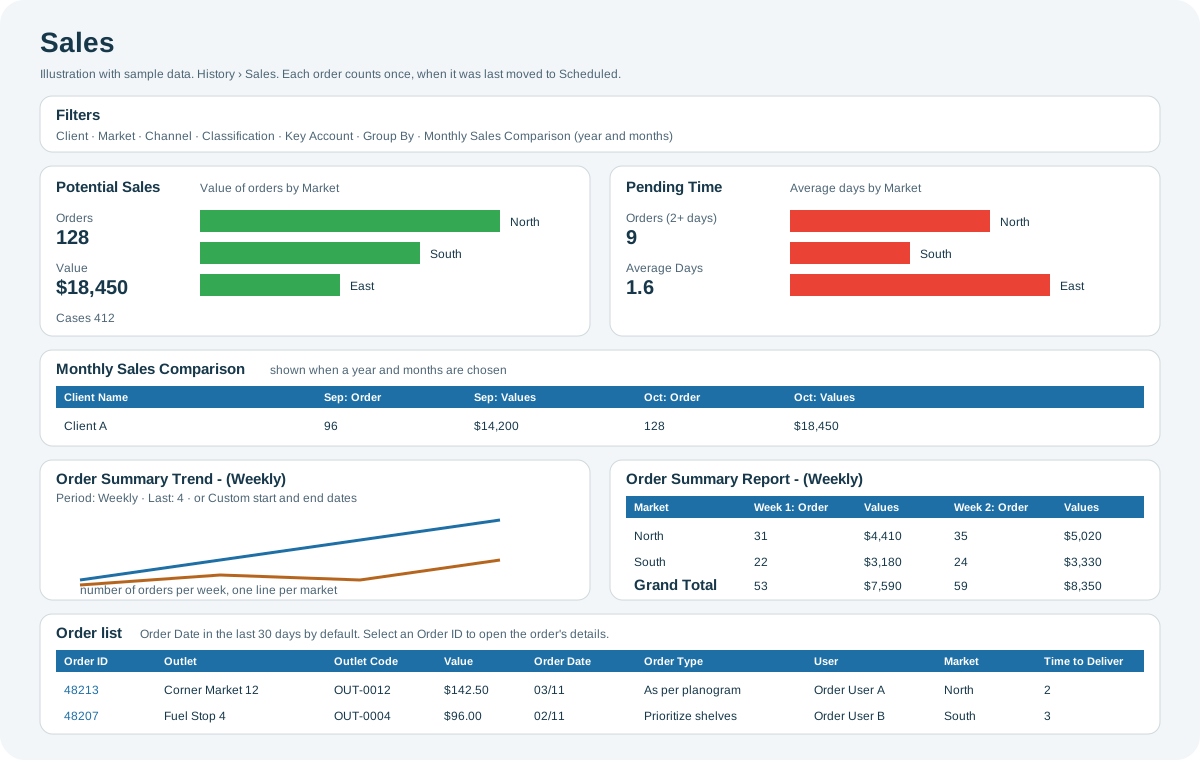
Open the full-size Sales diagram.
When to use it
- To see how many orders were scheduled in a week, month or quarter, and what they were worth.
- To compare months, markets or channels.
- To check how long orders took to be delivered.
Who uses it
| Role | Typical use |
|---|---|
| Sales and distributor managers | Track order volume and value by market, channel or client. |
| Replenishment and order teams | Check which orders were scheduled, by whom, and how quickly they were delivered. |
Why it helps
- Totals and trends in one place: see order counts, values and trends without exporting data.
- Each order counted once: an order that goes back to Inbox and is scheduled again still counts only once.
Where to find it
Select History > Sales in the menu.
Access is role-based
Sales is a separate permission in your role. The charts at the top need an additional permission and are not shown on phones. If you cannot see the screen or the charts, contact your administrator or CoolR Support.
How it works
Playbook records every move of an order to Scheduled. The Sales screen uses only the latest of these moves for each order, so each order appears once, with its current value and cases.
The comparison table, trend and report place each order on the date it was last scheduled. The order list uses the order date.
Using the screen
Filters
The filter panel at the top applies to the whole screen:
- Client, Market, Channel, Classification and Key Account narrow the orders.
- Group By groups the order list. If you group by client, market, channel or classification, the trend and report use the same grouping.
- Monthly Sales Comparison shows the comparison table for the year and months you choose.
Charts
- Potential Sales: the number of orders, their value and cases, with a bar chart of order value. Use the tabs to group the chart by Primary Sales Rep, City, State, Market, Distributor, Channel or Pre-Seller Route.
- Pending Time: the number of orders that met the minimum order value and quantity more than 2 days ago, and the average number of days since orders met them. The chart shows the average days for the same groups.
Both charts count only orders that met the minimum order value and quantity.
Monthly Sales Comparison
When you choose a year and one or more months in the filter panel, this table shows, for each client and month, the number of orders (Order) and their value (Values), with a Grand Total row.
Order Summary Trend and Order Summary Report
- Order Summary Trend is a line chart of the number of orders in each period, with one line per market, or per group if you chose one in Group By.
- Order Summary Report is a table of the number of orders and their value in each period, for each group, with a Grand Total row.
For each, choose a Period (Monthly, Weekly, Daily or Quarterly) and, in Last, how many recent periods to show. Both open on Weekly. To pick a start and end date instead, choose Custom.
Order list
The list shows one row per order, newest first. It opens on orders with an order date in the last 30 days; change the Order Date filter to see another period.
| Columns | What they show |
|---|---|
| Order ID | The order. Select it to open the order's details, including its products. |
| Outlet, Outlet Code | The outlet the order is for. City and Postal Code are hidden by default. |
| Value, Cases | The order's value in your currency, and its number of cases. Cases is hidden by default. |
| Order Date, Order Type | When the order was created, and the replenishment model that created it. |
| User | The person who last moved the order to Scheduled. |
| Market, Channel, Classification, Distributor, Key Account, Client | Where the outlet belongs. You can group the list by these columns. |
| Replenish Date, Time to Deliver | When the order was delivered, and the number of days from the order date to delivery. |
Use the column menu to sort, filter, and show or hide columns. Select Export to download the list. See Working with tables.
Why you might not see something
- The screen is missing from the menu: ordering is not enabled for your account, or your role does not include it. Contact your administrator or CoolR Support.
- The charts at the top are missing: your role does not include them, or you are using a phone.
- An order is missing: it was never moved to Scheduled, or its order date is outside the Order Date filter.
- The comparison table is missing: choose a year and at least one month under Monthly Sales Comparison. You cannot choose a future year.
- An outlet is missing: you see only the outlets assigned to you. See Access, roles and permissions.
Tips
- To compare months of the same year, choose the year and the months under Monthly Sales Comparison.
- To find slow deliveries, sort the order list by Time to Deliver.
- To see every status change of an order, not just when it was scheduled, use Order Suggestions.
Related pages
Last updated: November 17, 2026. Screens and options vary with your role and your organization's setup.