
Appearance
Product Distribution: how widely each product is distributed
The Portfolio area shows how many of your coolers each product was recognized in. It has two tabs: Product Distribution covers all coolers, and Product Distribution Compliance covers only the coolers whose planogram includes the product.
Product Distribution at a glance
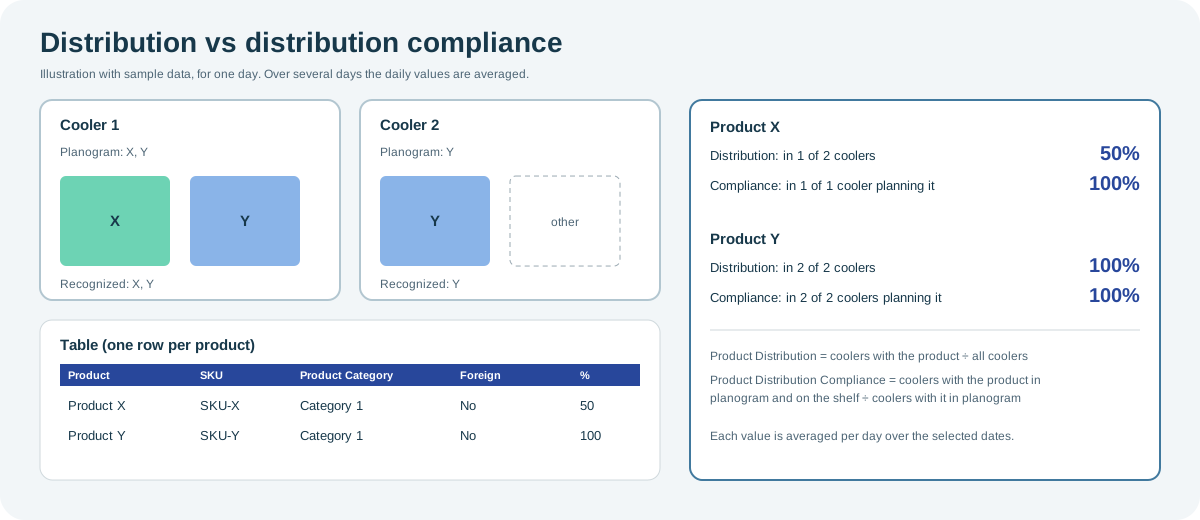
Open the full-size Product Distribution diagram.
When to use it
- Product Distribution: see how widely each product, including other companies' products, is present in your coolers.
- Product Distribution Compliance: check whether products are present where their planogram expects them.
Who uses it
| Role | Typical use |
|---|---|
| Brand and category managers | Track the distribution of products and launches. |
| Sales managers | Find planogram products missing from coolers. |
Where to find it
Select Business Performance > Product Distribution or Product Distribution Compliance. Both open this page; switch between them with the tabs at the top. Point to the information icon on a tab to see its definition. The filter panel and cards are described on the Business Performance overview.
How it works
Both values are calculated for each day, then averaged over the selected dates.
| Tab | Meaning | Formula |
|---|---|---|
| Product Distribution | Share of all coolers in which the product was recognized. | Average per day of (coolers with the product ÷ all coolers) |
| Product Distribution Compliance | Of the coolers whose planogram includes the product, the share in which it was recognized. | Average per day of (coolers with the product in planogram and on the shelf ÷ coolers with the product in planogram) |
Using the screen
- In the filter panel, choose the Date Range. It opens on Last 7 Days; other options include Last 14 Days, Last 30 Days, Last 90 Days, Last Year, the current week, month, quarter or year to date, and Custom. A range can cover up to 366 days.
- The table lists one row per product: Product, SKU, Product Category, Foreign (another company's product) and % (the tab's value).
- Sort, filter and export the table with the table toolbar. Exports are named Product Distribution or Product Availability.
Why you might not see something
- A product is missing from Product Distribution: it is not in your product list, or the filters exclude it. Products that were not recognized show 0%.
- "Date range cannot exceed 366 days": choose a shorter range.
- A product is missing from Product Distribution Compliance: none of the planograms of the coolers in your selection include it.
Tips
- Sort by % to find the products with the lowest distribution.
- Compare the two tabs for a product: high distribution but low compliance means the product is present, but not where the planogram expects it.
Related pages
Last updated: November 12, 2026. Screens and options vary with your role and your organization's setup.