
Appearance
Devices and installations: device tracking, installations and VistaZ battery
Three System Logs screens follow your devices from installation to day-to-day health:
| Screen | Shows | One row per |
|---|---|---|
| Device Tracking | How many devices you have by type and status, and the details of each one. | Count, then device |
| Installations | Which assets were installed, when, by whom and at which outlet. | Asset |
| VistaZ Battery Analysis | Battery health and signal strength of your VistaZ devices, week by week. | VistaZ device |
Devices and installations at a glance
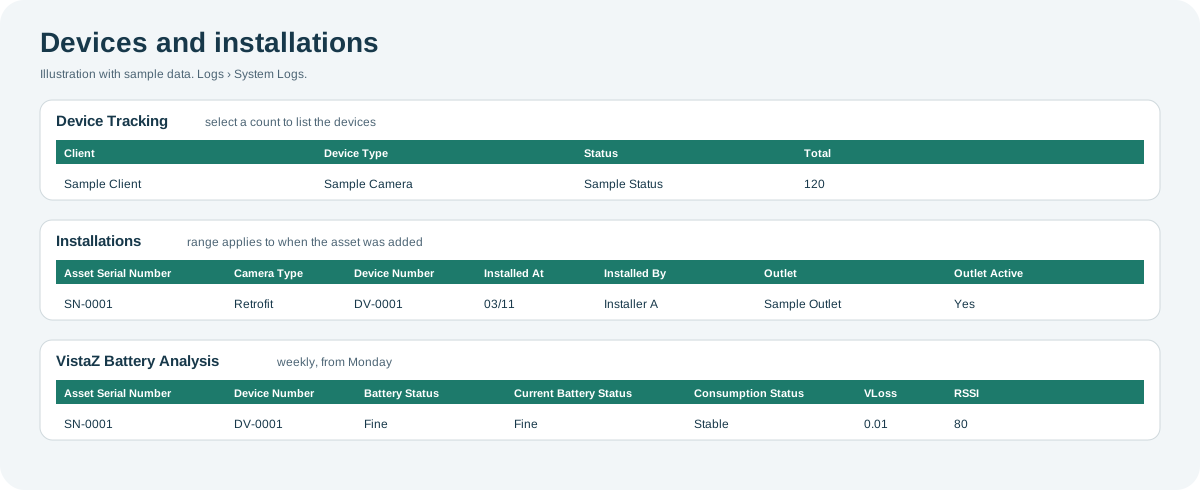
Open the full-size devices and installations diagram.
When to use it
- To count your devices by type and status, and find the ones that have stopped reporting.
- To check when an asset was installed, by whom, and at which outlet.
- To find VistaZ devices with a draining battery before they stop reporting.
Where to find it
Select Logs and then Device Tracking, Installations or VistaZ Battery Analysis, under System Logs.
Access is role-based
Each of these screens is a separate permission in your role, so you might see some and not others. If a screen you need is missing, contact your administrator or CoolR Support.
Device Tracking
What it shows: a count of your devices by client, device type and status. Select a count to list those devices, with their latest readings and where they are installed. The screen has no date range; it shows each device's current state.
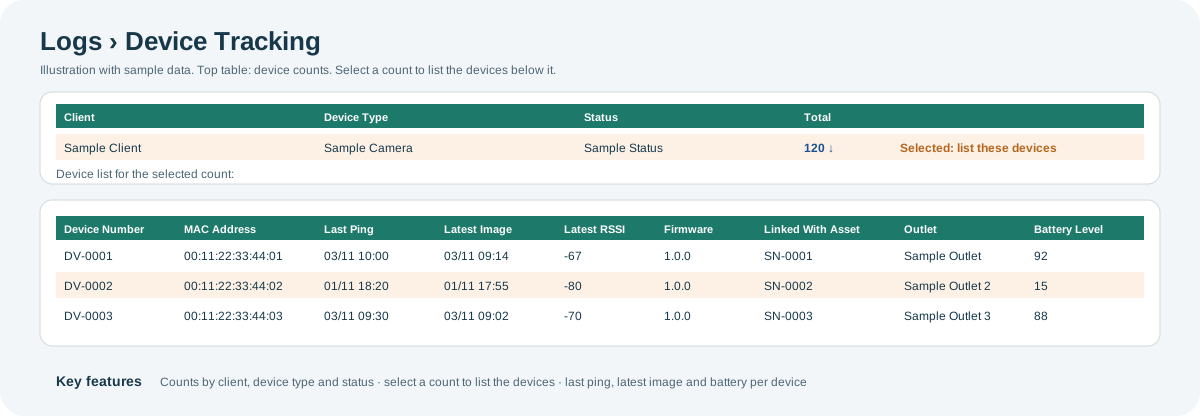
Open the full-size Device Tracking diagram.
Key features:
- Counts at a glance: the top table shows Client, Device Type, Status and Total.
- Drill down: select a value in a row to list the matching devices below the table. Total lists every device in that row, and Device Type lists all devices of that type for the client, whatever their status.
- Latest state of each device: Last Ping, Latest Image Date Time, Latest RSSI, Battery Level and Temperature show when each device was last heard from and how it was doing.
- Filter the device list: after you select a count, the filter panel at the top narrows the list by client, market, channel, classification or key account, and can group the rows.
| Device list columns | What they show |
|---|---|
| Device Type, MAC Address, Device Number, IMEI, Sim# | Which device it is. |
| Last Ping, Last Ping UTC, Wi-Fi Last Ping, Latest Image Date Time, Latest Health Record Event Time | When the device was last heard from, and when it last sent an image or reading. |
| Latest RSSI, Battery Level, Image Battery Value, Temperature, Light Intensity, Latest Latitude, Latest Longitude | The device's latest readings and location. |
| Firmware Version, HW Version, Production Tool Version, Auto DFU Update | The device's hardware and firmware. |
| Linked With Asset, Asset Type, Door Handle Location, Hub Location In Cooler, Missing | The asset the device is fitted to, and whether that asset was reported missing. |
| Outlet, Outlet Code, Street, City, State, Country, Time Zone, Market, Channel, Classification, Distributor, Key Account | Where the device is installed. |
| Shipping Date, Delivery Date, Warranty End Date, Asset Installation Date, Inventory Location, Tracking# | The device's delivery and warranty history. |
| Last Country, Last Operator | The country and mobile operator of the device's SIM. |
Installations
What it shows: your assets and their installation details, newest installation first.
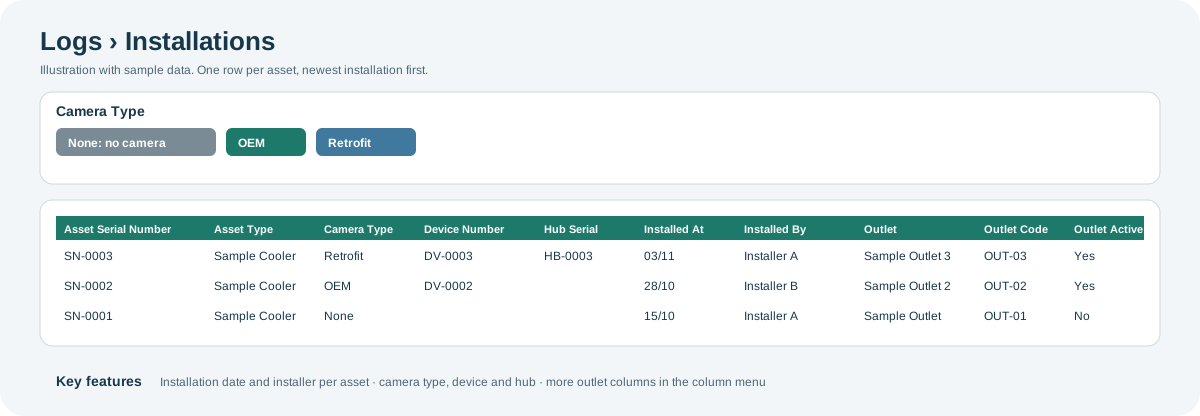
Open the full-size Installations diagram.
Key features:
- Who installed what, and when: Installed At and Installed By show when and by whom each asset was installed.
- Camera and device: Camera Type is None, OEM or Retrofit, with the Device Number, Smart Device Type and Hub Serial.
- Outlet details: Outlet, Outlet Code and Outlet Active. Address, sales rep, delivery route and planogram columns are hidden by default; show them from the column menu.
- Date range on when the asset was added: the range applies to the date the asset was added to Playbook, not to Installed At.
| Columns | What they show |
|---|---|
| Asset Serial Number, Asset Type | The asset. |
| Camera Type, Device Number, Smart Device Type, Hub Serial | The camera and devices fitted to the asset. |
| Installed At, Installed By | When the asset was installed, and by whom. |
| Outlet, Outlet Code, Outlet Active | Where it is installed, and whether the outlet is active. |
| Street, City, State, Postal Code, Primary Sales Rep, Secondary Sales Rep, Delivery Route, Planogram (hidden) | More details about the outlet. |
VistaZ Battery Analysis
What it shows: the battery and signal health of your provisioned VistaZ devices. A chart groups the devices by signal strength and battery voltage, and a table lists each device. The report compares weeks, which start on Monday.
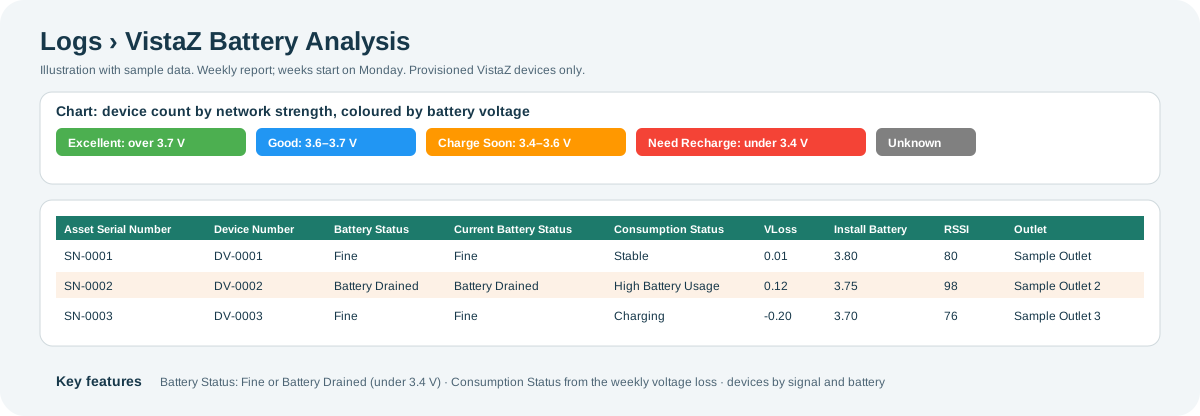
Open the full-size VistaZ Battery Analysis diagram.
Key features:
- Devices by signal and battery: the chart counts devices by their latest network strength (Excellent, Good, Ok, Marginal, No Network or Unknown). Each bar is split by battery voltage: Excellent (over 3.7 V), Good (3.6 to 3.7 V), Charge Soon (3.4 to 3.6 V), Need Recharge (under 3.4 V) or Unknown.
- Battery status: Battery Status is Battery Drained when this week's latest battery reading is under 3.4 V, and Fine otherwise. Current Battery Status is Battery Drained when the battery was under 3.4 V at the start of both this week and last week.
- How fast the battery drains: VLoss is the voltage lost between the start of last week and the start of this week. Consumption Status is High Battery Usage when the battery lost voltage, Stable when it stayed the same or rose by up to 0.03 V, and Charging when it rose by more.
- Filters: the filter panel narrows the chart and table by market, channel, classification, key account, outlet, asset or device.
| Columns | What they show |
|---|---|
| Asset Serial Number, Device Number | The asset and its VistaZ device. |
| Battery Status, Current Battery Status, Consumption Status, VLoss | The battery's state and how fast it drains. |
| Install Battery, Install Battery Status, Install Date | The battery when the device was installed. |
| RSSI | The device's signal strength. |
| Outlet, Outlet Code, Market, Channel, Classification, Distributor, Key Account | Where the device is installed. |
Why you might not see something
- A screen is missing from the menu: your role does not include that screen. Contact your administrator or CoolR Support.
- The device list under Device Tracking is empty: select a value in the top table first.
- An installation is missing from Installations: the date range applies to the date the asset was added to Playbook. Widen the range to include it.
- A device is missing from VistaZ Battery Analysis: only provisioned VistaZ devices are listed.
- Status columns are blank on VistaZ Battery Analysis: the device sent no battery readings for the weeks being compared.
Tips
- On Device Tracking, sort the device list by Last Ping to find devices that have stopped reporting, then check Pings for them.
- On VistaZ Battery Analysis, look for High Battery Usage in Consumption Status to plan battery visits. The status columns cannot be sorted or filtered, so export the table to sort by them.
Related pages
Last updated: November 16, 2026. Screens and options vary with your role and your organization's setup.