
Appearance
Activity: alerts, commands and visits
Three Telemetry Logs screens record what happened to your coolers:
| Screen | Shows | One row per |
|---|---|---|
| Alerts | Alerts raised on your coolers and how they were handled. | Alert |
| Commands | Commands sent to devices, and whether they ran. | Command |
| Visits | Recorded visits to coolers, and whether each cooler was found. | Visit |
Activity at a glance
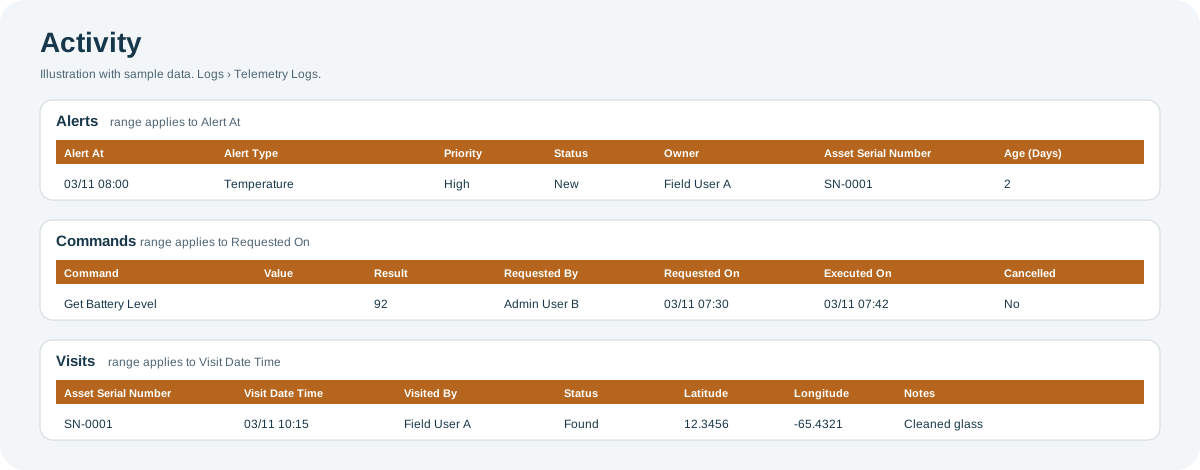
Open the full-size activity diagram.
When to use it
- To review the alerts on your coolers and how they were resolved.
- To check whether a command reached a device and what it returned.
- To confirm when a cooler was last visited, and whether it was where it should be.
Where to find it
Select Logs and then Alerts, Commands or Visits, under Telemetry Logs. The date range and table work as described in the Logs overview.
Access is role-based
Each of these screens is a separate permission in your role, so you might see some and not others. If a screen you need is missing, contact your administrator or CoolR Support.
Alerts
What it shows: every alert raised on your coolers in the date range, open or closed, with its owner and how it was handled. The list is read-only.
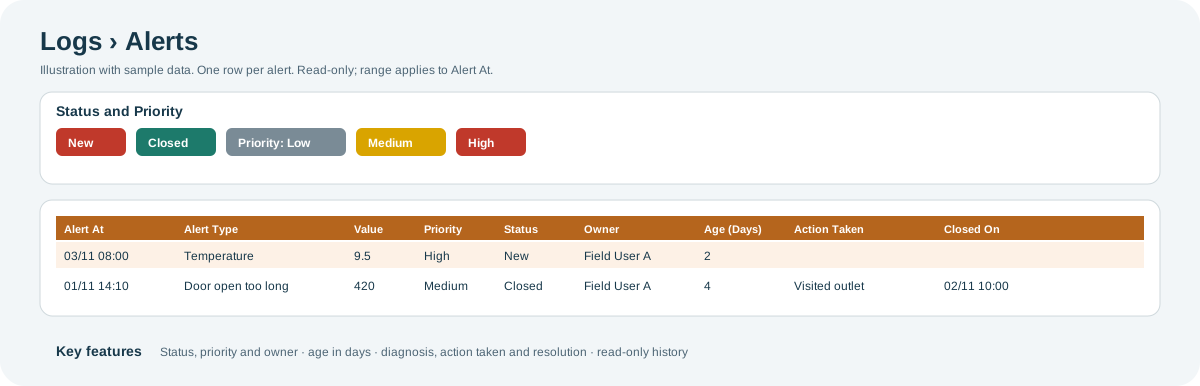
Open the full-size Alerts diagram.
Key features:
- Status and priority: Status is New (open) or Closed. Priority is Low, Medium or High.
- Ownership and age: Owner and Manager show who is responsible, and Age (Days) shows how long the alert has been open.
- How it was handled: Diagnosis, Recommended Actions, Action Taken and Resolution record the follow-up. Snoozed Until shows the date until which an alert was put aside.
- Kind of alert: Alert Category groups alerts, for example Business Alert or System Alert.
| Columns | What they show |
|---|---|
| Alert ID, Alert At, Alert Type, Alert Definition, Alert Category | Which alert was raised, and when. |
| Value, Unit, Alert Text | The reading or message that raised it. |
| Priority, Status, Owner, Manager, Age (Days) | How urgent it is, who is responsible, and how long it has been open. |
| Diagnosis, Diagnosis Date, Recommended Actions, Action Taken, Resolution, Closed On, Snoozed Until | How the alert was handled. |
| Asset Serial Number, Asset Type, Device Number, MDM Hub Serial Number, Image Source | The cooler and device. |
Commands
What it shows: every command sent to a device, such as reading its battery level, changing a camera setting or updating its firmware, and whether the device ran it and with what result.
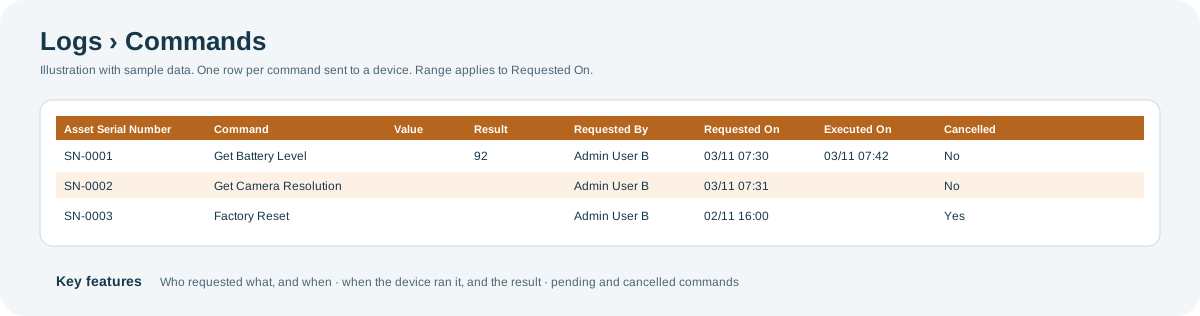
Open the full-size Commands diagram.
Key features:
- Request and outcome on one row: Command, Requested By and Requested On show what was requested, by whom and when. Executed On and Result show when the device ran it and what it returned.
- Pending commands: a blank Executed On means the device has not run the command yet.
- Cancelled commands: Cancelled shows a command that was withdrawn before it ran.
- Settings changes: Requested Configuration and Value show the setting that was asked for.
| Columns | What they show |
|---|---|
| Command, Requested Configuration, Value | What was requested. |
| Requested By, Requested On | Who requested it, and when. |
| Executed On, Result | When the device ran it, and the outcome. |
| Modified On, Cancelled | When the command was last updated, and whether it was cancelled. |
| Asset Serial Number, Device Number | The cooler and device. |
Visits
What it shows: every recorded visit to a cooler, with whether the cooler was found at its outlet.
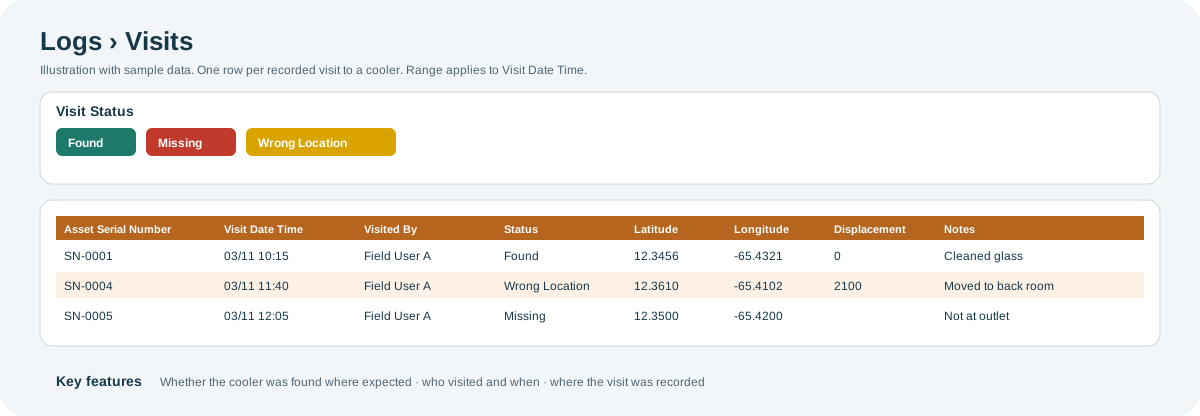
Open the full-size Visits diagram.
Key features:
- Was the cooler there? Status is Found, Missing or Wrong Location.
- Who and when: Visited By and Visit Date Time show who made the visit and when.
- Where it was recorded: Latitude and Longitude show where the visit was logged, along with the Displacement.
- Notes: comments the visitor added.
| Columns | What they show |
|---|---|
| Asset Serial Number | The cooler visited. |
| Visit Date Time, Visited By | When the visit happened, and who made it. |
| Status | Found, Missing or Wrong Location. |
| Latitude, Longitude, Displacement | Where the visit was recorded. |
| Notes | Comments from the visit. |
Why you might not see something
- A screen is missing from the menu: your role does not include that screen. Contact your administrator or CoolR Support.
- An alert is missing: it was raised outside the date range. The range applies to Alert At, not to when the alert was closed.
- Executed On is blank: the device has not run the command yet.
- A cooler has no visits: no visit was recorded for it in the date range.
Tips
- Filter Alerts by Status to list the alerts still open, and sort by Age (Days) to see the oldest first.
- Filter Commands for a blank Executed On to list commands still waiting for their device.
- Filter Visits by Status to list coolers reported Missing or at the Wrong Location.
Related pages
Last updated: November 16, 2026. Screens and options vary with your role and your organization's setup.