
Appearance
Connectivity and location: pings, cellular events, cell towers and GPS
Four Telemetry Logs screens show how your devices connect and where they are:
| Screen | Shows | One row per |
|---|---|---|
| Pings | When and where a hub last picked up the device's signal. | Signal picked up |
| Cellular Events | What happened on the device's mobile connection. | Connection event |
| Cell Towers | Which mobile cell the device connected to. | Cell connection |
| GPS | The Wi-Fi access points the device found in a location scan. | Access point found |
Connectivity and location at a glance
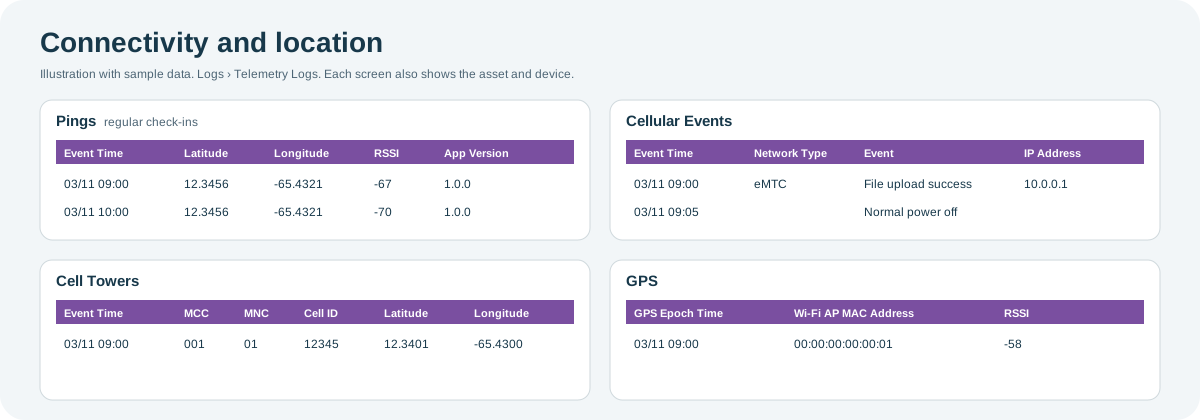
Open the full-size connectivity and location diagram.
When to use it
- To check whether a device is still in contact with Playbook, and when it was last heard.
- To investigate poor mobile coverage or failed uploads at an outlet.
- To check where a device is reporting from, for example after a Motion event.
Where to find it
Select Logs and then Pings, Cellular Events, Cell Towers or GPS, under Telemetry Logs. The date range and table work as described in the Logs overview.
Access is role-based
Each of these screens is a separate permission in your role, so you might see some and not others. If a screen you need is missing, contact your administrator or CoolR Support.
Most screens also show the cooler and device (Asset Serial Number, Device Serial, Device Type), the device's Time Zone, Created On (when Playbook received the record) and the gateway it came through.
Pings
What it shows: each time a hub picked up the device's signal, so you can see when the device was last heard.
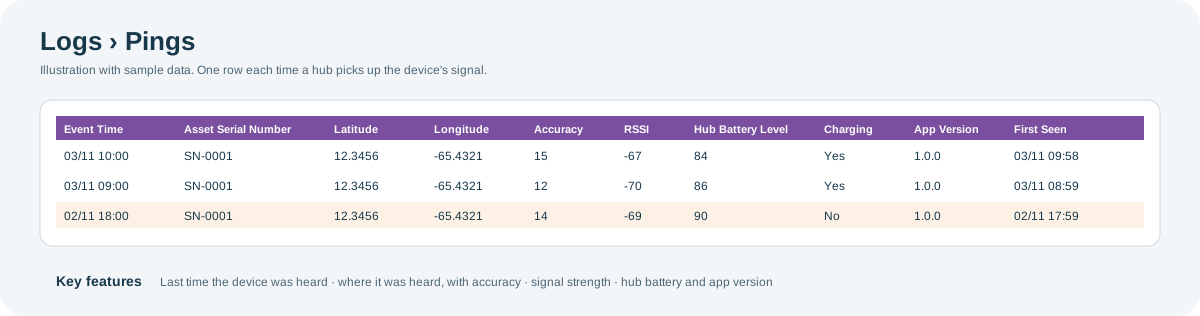
Open the full-size Pings diagram.
Key features:
- Last heard: the newest row shows when the device was last picked up. A long gap between rows means no hub heard it in that time.
- Where it was heard: Latitude and Longitude show where the ping was recorded, and Accuracy shows how precise that location is.
- Signal strength: RSSI shows how strong the signal was; values closer to zero are stronger.
- The hub's state: Hub Battery Level, Charging and App Version describe the hub that picked up the signal.
| Columns | What they show |
|---|---|
| Event Time | When the signal was picked up. |
| Latitude, Longitude, Accuracy | Where it was picked up, and how precise the location is. |
| RSSI, Advertisement | Signal strength, and the data the device broadcast. |
| Hub Battery Level, Charging, App Version | The state of the hub that picked up the signal. |
| First Seen | When the hub first saw the device. |
Cellular Events
What it shows: each step and error on a device's mobile (cellular) connection, such as connecting to the network, uploading a file, losing the network or powering off.
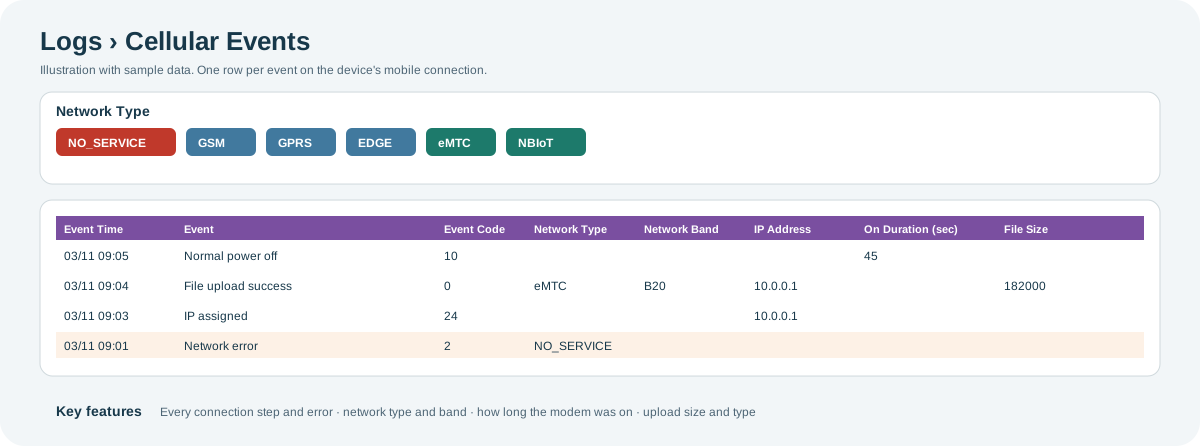
Open the full-size Cellular Events diagram.
Key features:
- Each connection step: Event names what happened, and Event Code is its number. Events include successful file uploads, network and server connection errors, SIM failures and changes, IP address assignments, and normal or forced power-offs.
- Network quality: Network Type is NO_SERVICE, GSM, GPRS, EDGE, eMTC or NBIoT, with the Network Band. NO_SERVICE means the device found no network.
- Modem time: On Duration (sec) shows how long the mobile modem stayed on, which affects battery life.
- Uploads: File Size and File Type show what the device sent.
| Columns | What they show |
|---|---|
| Event Time | When the event happened. |
| Event, Event Code | What happened on the connection. |
| Network Type, Network Band | The mobile network the device used. |
| IP Address | The address the network gave the device. |
| On Duration (sec), Battery Level | How long the modem was on, and the battery level. |
| File Size, File Type | The file being uploaded, where relevant. |
Cell Towers
What it shows: the mobile network cells a device connected to. Each cell is identified by its network codes and has an approximate location.
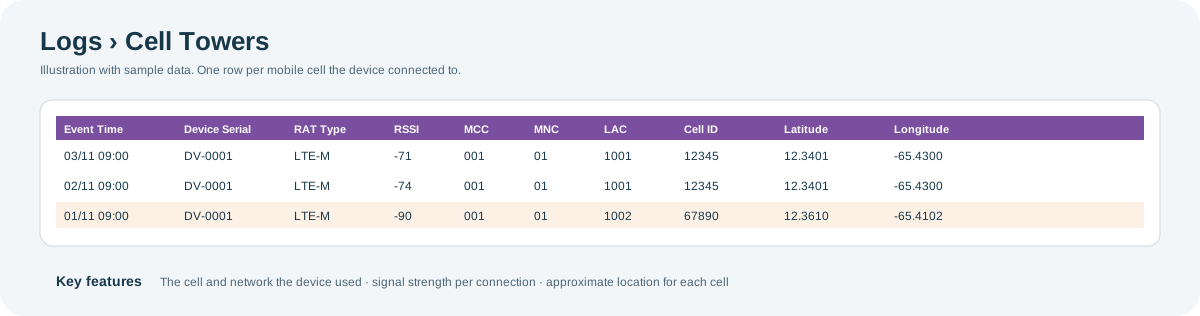
Open the full-size Cell Towers diagram.
Key features:
- Which network and cell: MCC (country), MNC (mobile operator), LAC (area) and Cell ID identify the cell.
- Radio technology: Cell Type, RAT and RAT Type show the kind of mobile technology used.
- Approximate location: Latitude and Longitude give the cell's location. This shows the area the device is in, not its exact position.
- Signal strength: RSSI shows the signal strength of each connection.
| Columns | What they show |
|---|---|
| Event Time | When the device was connected to the cell. |
| Device MAC Address, Device Serial | The device. |
| Cell Type, RAT, RAT Type | The mobile technology. |
| RSSI | Signal strength. |
| MCC, MNC, LAC, Cell ID | The network codes that identify the cell. |
| Latitude, Longitude | The location for that cell. |
GPS
What it shows: location scans from devices that support them. Each row is one Wi-Fi access point the device found, with the scan time (GPS Epoch Time) and the access point's signal strength.
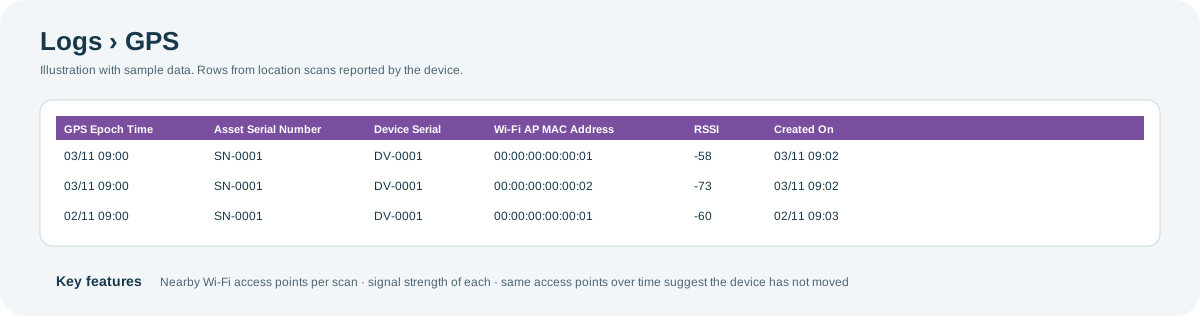
Open the full-size GPS diagram.
Key features:
- One scan, several rows: rows with the same GPS Epoch Time come from one scan that found several access points.
- Access points and strength: Wi-Fi AP MAC Address identifies each access point, and RSSI shows how strong its signal was.
- A sign of movement: if the access points change from one scan to the next, the device may have moved.
| Columns | What they show |
|---|---|
| GPS Epoch Time | When the scan was made. |
| Wi-Fi AP MAC Address | A Wi-Fi access point the device found. |
| RSSI | The access point's signal strength. |
| Gateway MAC, Gateway Number | The gateway the record came through. |
Why you might not see something
- A screen is missing from the menu: your role does not include that screen. Contact your administrator or CoolR Support.
- A device has no rows on a screen: it does not support that kind of record, such as GPS or cellular, or it sent none in the date range.
- Network Type is blank on some Cellular Events: it is not shown for power-off and IP address events, because the value is out of date at that point.
- Pings stop: no hub was close enough to pick up the device, or the device is off.
Tips
- If a device stops reporting, check Pings for the last time it was heard, then Cellular Events for errors or power-offs around that time.
- Repeated NO_SERVICE events at one outlet point to poor mobile coverage there.
Related pages
Last updated: November 16, 2026. Screens and options vary with your role and your organization's setup.