
Appearance
ROI Report: the value of closing shelf-availability alerts faster
The ROI Report dashboard shows the value of acting quickly on Product On Shelf Availability alerts. For each product and month, it compares how quickly these alerts were closed against a baseline and puts a value on the hours saved.
It is available only if your organization has the Product On Shelf Availability alert set up.
ROI Report at a glance
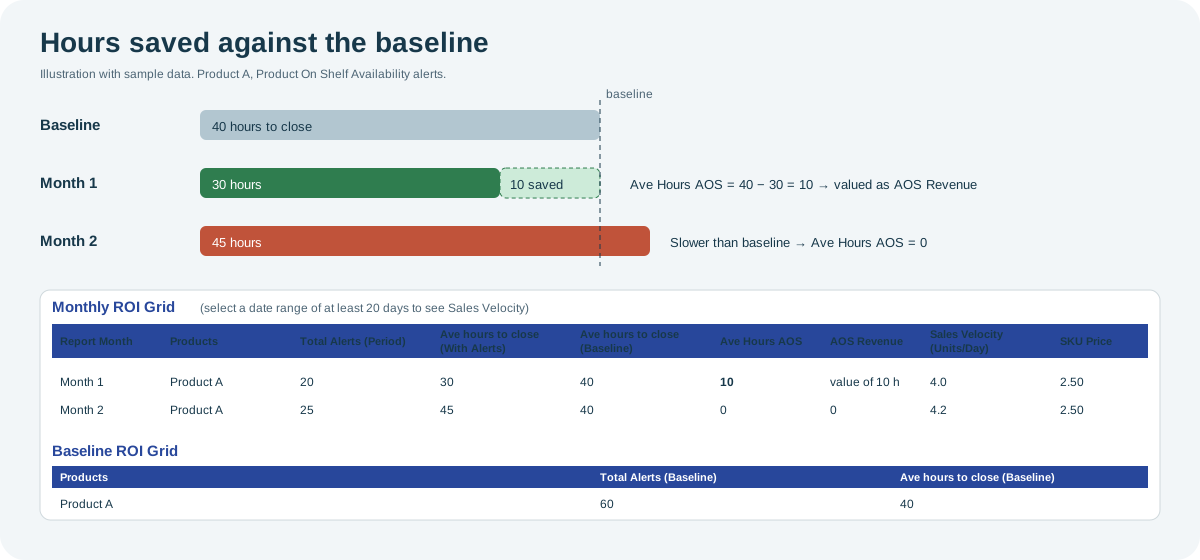
Open the full-size ROI Report diagram.
When to use it
Use it to show the value of acting quickly on shelf-availability alerts and to find products and months where alerts were closed more slowly than usual.
Who uses it
| Role | Typical use |
|---|---|
| Account and commercial managers | Show a client the value of acting on availability alerts. |
| Sales and merchandising managers | Find products where alerts are closed slowly. |
Where to find it
Select Dashboard > ROI Report in the menu. It shows the selected client. See Dashboards for client selection and filters.
How it works
- The baseline is each product's usual number of alerts and average hours to close them, shown in the Baseline ROI Grid.
- For each month, the dashboard compares the average hours to close that month's alerts with the baseline.
- When alerts were closed faster than the baseline, the difference is the hours saved: Ave Hours AOS = baseline hours − hours in the month. When they were closed more slowly, Ave Hours AOS is 0.
- AOS Revenue values the hours saved using the product's Sales Velocity and SKU Price.
Using the screen
Monthly ROI Grid
One row per product and month:
| Column | Shows |
|---|---|
| Report Month | The month. |
| Products | Product code and name. |
| Total Alerts (Period) | Number of shelf-availability alerts for the product in the month. |
| Ave hours to close (With Alerts) | Average hours to close those alerts. |
| Ave hours to close (Baseline) | The product's baseline average hours to close. |
| Ave Hours AOS | Hours saved compared with the baseline, or 0. |
| AOS Revenue | Value of the hours saved. |
| Sales Velocity (Units/Day) | Units sold per day. Shown only when the selected date range covers at least 20 days. |
| SKU Price | The product's price. |
Baseline ROI Grid
One row per product, with Total Alerts (Baseline) and Ave hours to close (Baseline).
Why you might not see something
- The dashboard is not in your menu or shows no data: your organization does not have the Product On Shelf Availability alert set up, or your role does not include the dashboard.
- Sales Velocity is 0: select a date range of at least 20 days. A month can still show 0 if it has no sales data.
- AOS Revenue is 0: alerts were not closed faster than the baseline, or Sales Velocity is 0.
Related pages
Last updated: November 12, 2026. Screens and options vary with your role and your organization's setup.