
Appearance
Logs: review the records your devices send
The Logs menu shows the detailed records behind Playbook's summary screens, in two groups:
- Telemetry Logs: the records your devices send, such as images, sensor readings, connectivity events and device activity.
- System Logs: records about your account, such as device inventory, installations, sign-ins, emails sent, subscriptions and data imports.
Most screens are read-only tables of records for a date range, across all the assets you can access.
Access is role-based
Each Logs screen is a separate permission in your role, so you might see some screens and not others. If a screen you need is missing, contact your administrator or CoolR Support at support@coolr.ai.
Logs at a glance
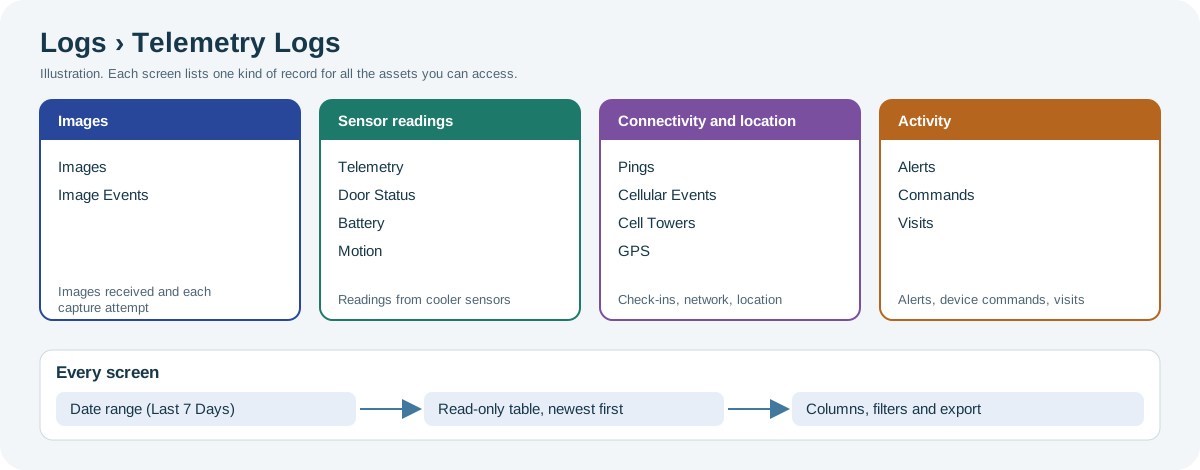
Open the full-size Telemetry Logs map.
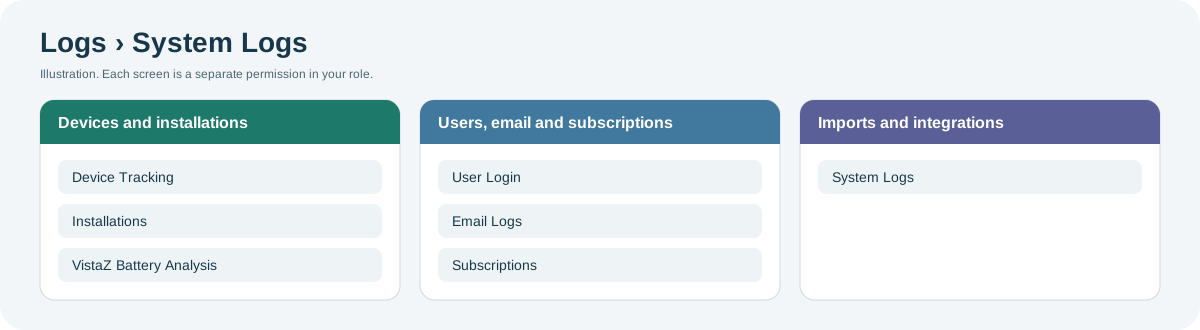
Open the full-size System Logs map.
When to use it
Use a log when a summary screen, such as Asset Performance, shows a problem and you need the records behind it. For example, if a cooler stopped sending images, check whether it is still sending pings.
Who uses it
| Role | Typical use |
|---|---|
| Support and deployment teams | Find out why a device stopped reporting. |
| Field service teams | Check door, temperature and battery readings before a visit. |
| Asset managers | Review alerts, commands and visits across many coolers. |
| Administrators | Review installations, sign-ins, emails sent, subscriptions and data imports. |
Why it helps
- All assets in one table: see every cooler's records at once, instead of opening each asset.
- Familiar controls: most screens share the same date filter and table.
Where to find it
Select Logs in the menu. The screens are in two groups. Under Telemetry Logs:
| Screen | What it records | Page |
|---|---|---|
| Images, Image Events | Images received and each capture attempt. | Images |
| Telemetry, Door Status, Battery, Motion | Sensor readings from the cooler. | Sensor readings |
| Pings, Cellular Events, Cell Towers, GPS | Device check-ins, network and location. | Connectivity and location |
| Alerts, Commands, Visits | Alerts raised, commands sent to devices and asset visits. | Activity |
Under System Logs:
| Screen | What it records | Page |
|---|---|---|
| Device Tracking, Installations, VistaZ Battery Analysis | Device counts and details, installations, and VistaZ battery health. | Devices and installations |
| User Login, Email Logs, Subscriptions | Sign-ins, emails and notifications sent, and active subscriptions. | Users, email and subscriptions |
| System Logs | Data imports and order integration runs. | Imports and integrations |
Your menu shows only the screens your role includes. Each screen is granted separately; for example, a role can include Alerts but not Commands. Your administrator assigns roles. To change what a role includes, your administrator contacts CoolR Support. See Access, roles and permissions.
How it works
Devices send their records to Playbook, and each Telemetry Logs screen lists one kind of record. The same records appear on the history tabs of an asset in Assets or a device in Devices. Use those tabs for one cooler and Logs for many.
Most Telemetry Logs screens show two times: when the event happened, and Created On, when Playbook received the record. A device that was offline sends its records later, so the two can differ. Where shown, Time Zone is the device's time zone.
System Logs screens record what happens in your account: devices and their installation, user sign-ins, messages sent, subscriptions and data imports.
Using the screen
Date range
The filter panel above the table sets the date range. It opens on Last 7 Days. Choose another period, such as Last 30 Days or Month to Date, or choose Custom and pick a start and end date. On Images, the range can be up to 30 days.
The range applies to each screen's main date: the event time on most screens, Alert At on Alerts, Requested On on Commands and Visit Date Time on Visits.
On System Logs screens, the range applies to Login Time on User Login, Created On on Email Logs and System Logs, and the date the asset was added on Installations. Device Tracking and VistaZ Battery Analysis have no date range: they show the current state, with filters for client, market and other groupings. Subscriptions uses a month instead of a date range.
Table
On most screens, rows are listed newest first. The tables are read-only. Use the column menu to sort, filter, and show or hide columns, and select EXPORT to download the rows. See Working with tables.
Why you might not see something
- A screen is missing from the menu: your role does not include that screen. Contact your administrator or CoolR Support.
- The table is empty: there are no records in the date range, or a column filter excludes them. Widen the range or select CLEAR FILTER.
- Images offers no periods longer than 30 days: its range is limited to 30 days.
- A cooler is missing: you see only the assets you can access.
Tips
- To follow one cooler, filter by Asset Serial Number.
- If a cooler stops sending images, check Image Events and Pings for the same dates.
- To find devices that have stopped reporting, open Device Tracking and sort the device list by Last Ping.
Related pages
Last updated: November 16, 2026. Screens and options vary with your role and your organization's setup.