
Appearance
Asset Performance dashboard: camera health across all your assets
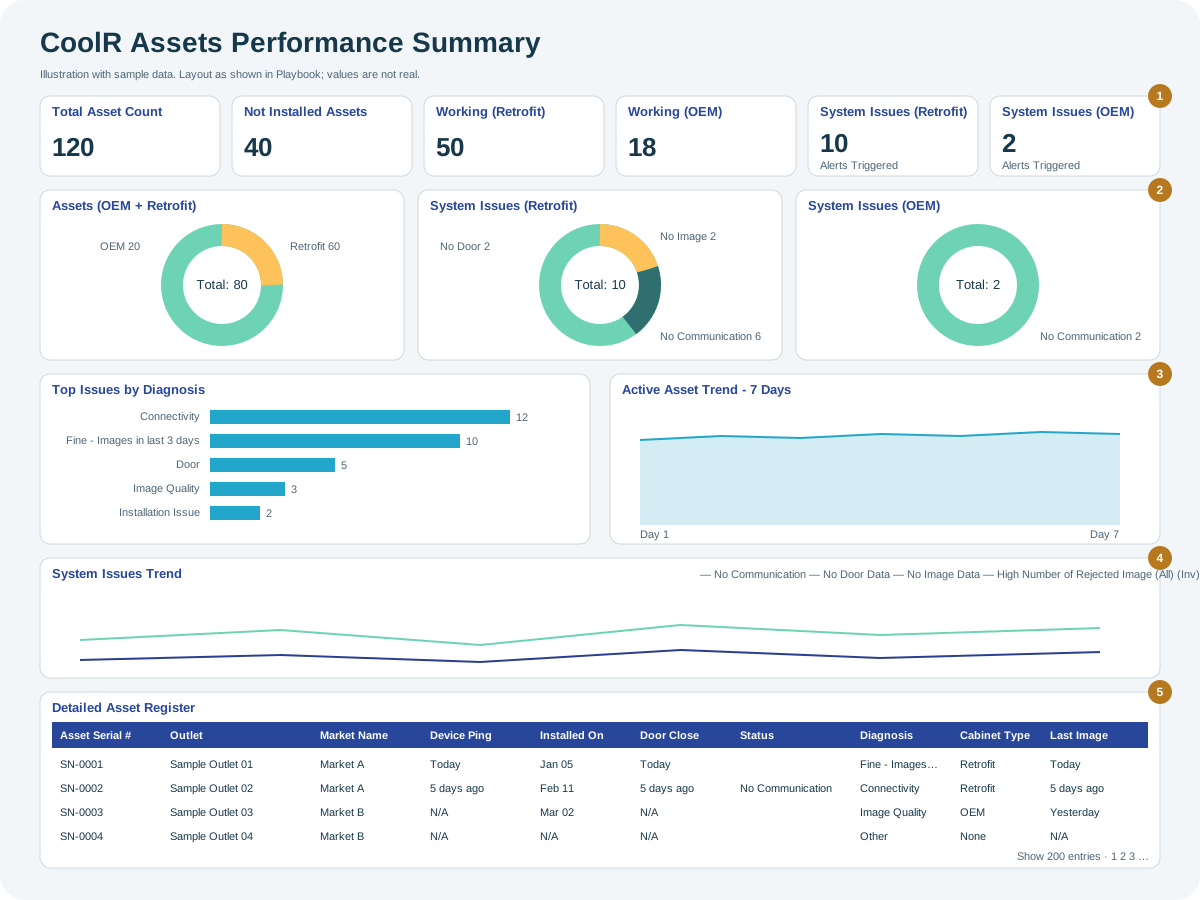
The Asset Performance dashboard summarizes how your camera-equipped assets are working: how many are installed and working, which have system issues and why, and how this has changed over recent days. It ends with a register of every asset and its diagnosis.
Asset Performance at a glance
Open the full-size Asset Performance dashboard diagram.
When to use it
Use it to check camera health across many outlets at once, for example in a weekly review, and to decide which assets need a visit. To follow up on a single asset, open it from the Assets screen. See Asset Performance.
Who uses it
| Role | Typical use |
|---|---|
| Operations and field service managers | Find assets with system issues and plan visits. |
| Account and support teams | Track installation progress and camera health for a client. |
Where to find it
Select Dashboard > Asset Performance in the menu. It shows the selected client. See Dashboards for client selection and filters.
Using the screen
Summary cards
| Card | Shows |
|---|---|
| Total Asset Count | All assets in the selection. |
| Not Installed Assets | Assets not yet installed. |
| Total Working Assets (Retrofit) / (OEM) | Assets of that camera type with no system issue. |
| System Issues (Retrofit) / (OEM) | Assets of that camera type with a system issue alert. |
Large numbers are shortened, for example 5.4k for about 5,400.
Charts
- Assets (OEM + Retrofit): assets by camera type, Retrofit or OEM. See Camera type on the Asset Performance page.
- System Issues (Retrofit) and System Issues (OEM): assets with a system issue, by status: No Communication, No Door or No Image. The Asset Performance page explains each status.
- Top Issues by Diagnosis: number of assets with each diagnosis. See Diagnosis.
- Active Asset Trend - 7 Days: number of unique active assets each day.
- System Issues Trend: system alerts over time by alert type, such as No Communication, No Door Data, No Image Data, High Number of Rejected Image and Inactive SKU Detected.
Select a legend entry to hide or show that series. All shows every series; Inv inverts the selection.
Detailed Asset Register
One row per asset, with Asset Serial #, Outlet, Market Name, Device Ping (last communication), Installed On, Door Close (last door activity), Status, Diagnosis, Cabinet Type (Retrofit, OEM or None), Device Number and Last Image Received. N/A means there is no value, for example because the asset has no camera.
Select a column header to sort. Choose how many entries to show per page, and use the page numbers below the table to move between pages.
Diagnosis
Diagnoses are checked in the order below, and each asset gets the first one that applies. A day counts as having images when at least one image arrived that day.
| Diagnosis | Applies when |
|---|---|
| Image Quality | OEM camera with rejected images on 2 or more of the last 3 days. |
| Fine - Images in last 3 days | Approved images on 2 or more of the last 3 days, or, for an OEM camera, on 1 of them. |
| Image Quality | OEM camera with rejected images on 1 of the last 3 days. |
| Installation Issue / Not Working | Images on 0 or 1 of the last 7 days: Not Working for an OEM camera, Installation Issue otherwise. |
| Latest Image Not Available | OEM camera with no images in the last 3 days. |
| Connectivity | Retrofit camera with no communication for more than 3 days. |
| Door | Retrofit camera on an asset with a door, with no door activity for more than 3 days. |
| Other | None of the above apply, for example an asset without a camera. |
Why you might not see something
- A message asks you to select a client: this dashboard shows one client at a time. See Dashboards.
- An asset shows N/A in most columns: it has no camera, or it has not sent data yet.
- An asset you expect is missing: check the dashboard filters and the selected client.
Tips
- Start with Top Issues by Diagnosis to see which problem affects the most assets.
- Sort the register by Diagnosis or Last Image Received to build a visit list.
Related pages
Last updated: November 12, 2026. Screens and options vary with your role and your organization's setup.