
Appearance
Working with tables: columns, filters, export and preferences
Most Playbook screens show their data in a table with the same toolbar. This page explains those controls once; each screen's own page covers only what is specific to that screen.
Tables at a glance
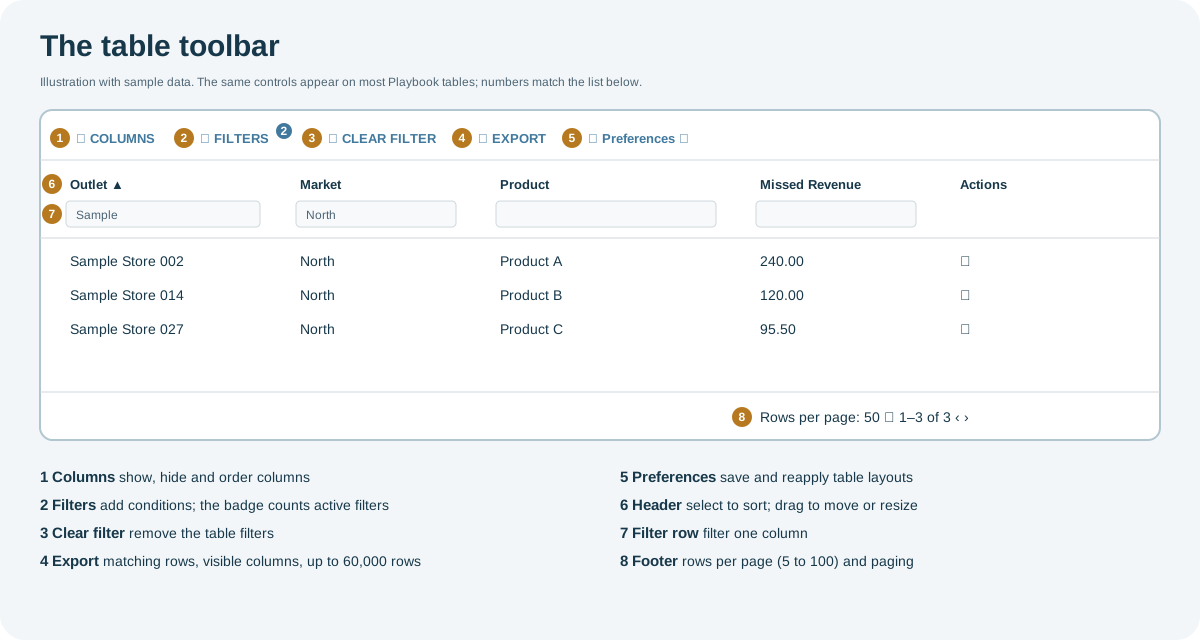
Open the full-size table toolbar diagram.
Who uses it
Everyone who works with Playbook lists, such as outlets, orders, alerts, assets and logs.
Where to find it
The toolbar sits above the table on each screen that has one. Which buttons appear depends on the screen and your role.
Why it helps
- Learn once: the same controls work on every table.
- Find rows fast: filter and sort the columns that support it.
- Keep your layout: save the columns, filters and sort order you use most and reapply them in one click.
Using the table
Columns
Select COLUMNS to show or hide columns. To move a column, drag its header; to resize it, drag the edge of the header. On some screens, key columns such as names and actions are pinned to the left or right, so they stay visible while you scroll.
Sort
Select a column header to sort by it. Select it again to reverse the order, and a third time to remove the sort.
Filter
You can filter a table in several ways:
- Filter row: most tables have a row of filter boxes under the column headers. Type or pick a value under a column to filter by it.
- Quick filters: some screens show filter controls for selected columns directly below the toolbar.
- FILTERS: add one or more conditions, such as Missed Revenue greater than 100, and choose whether all or any of them must match.
The number on FILTERS shows how many filters are active. CLEAR FILTER removes them all.
Many screens also have a filter panel above the table, for example for markets, dates or clients. CLEAR FILTER does not reset this panel.
Pages
The footer shows the number of rows. Choose how many rows to show per page (5, 10, 20, 50 or 100), and move between pages.
Export
Select EXPORT and choose a format. The available formats depend on the screen. Most screens offer Excel; some also offer CSV, Excel With Pivot, XML, HTML or JSON.
The file includes:
- all rows that match your filters, not only the current page, in the current sort order;
- only the visible columns, in their current order.
You can export up to 60,000 rows at a time. To export more, narrow the results with filters first.
Preferences
A preference saves the table's layout: the visible columns with their order and width, the filters, and the sort order.
- Set up the table the way you want it.
- Open the preferences menu at the end of the toolbar and select Add Preference.
- Enter a name (up to 20 characters) and, optionally, a description. Select Default to apply the preference each time you open this screen.
- Save. The preference now appears in the menu; select it to apply it.
Use Manage Preferences to edit or delete preferences, and Reset to Default to return the table to its original layout. Each screen has its own preferences.
Why you might not see something
- A toolbar button is missing: the screen does not offer it, or your role does not allow it (for example, EXPORT).
- An export format is missing: each screen offers only the formats that suit its data.
- Rows are missing: check the filter count on FILTERS, select CLEAR FILTER, and check the filter panel above the table.
Tips
- Before exporting, hide the columns you do not need: the file contains only the visible columns.
- Save the layout you use most as a Default preference, so the screen opens with it.
Related pages
Last updated: November 12, 2026. Screens and options vary with your role and your organization's setup.