
Appearance
Dashboards: summary views across your outlets and clients
The Dashboard menu opens interactive dashboards that summarize Playbook data in charts and tables. This page explains what all dashboards have in common: how to open them, which client's data they show, and what to do when one does not load.
Dashboards at a glance
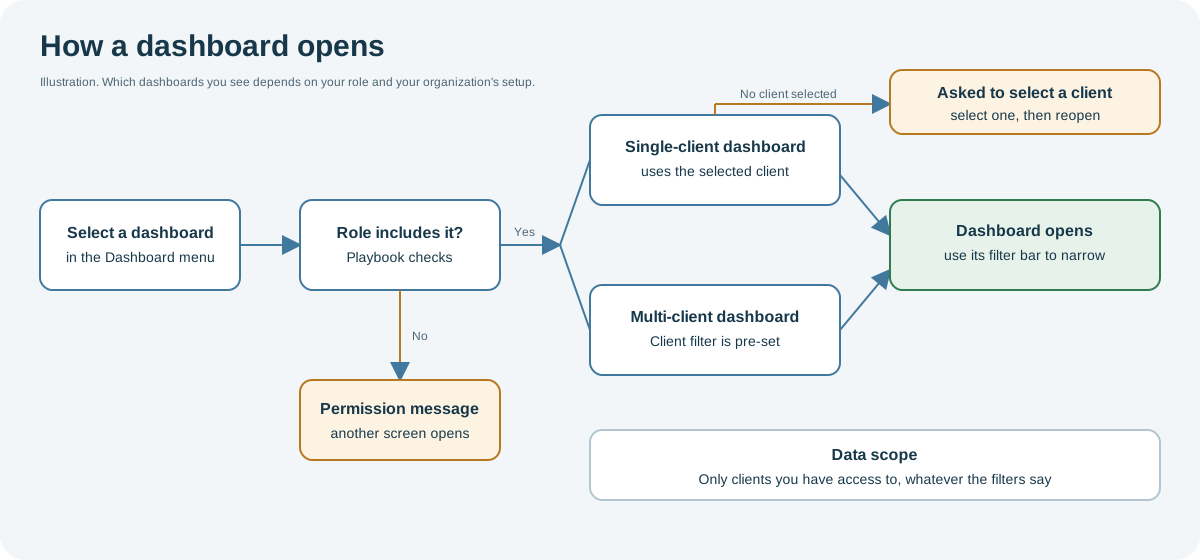
Open the full-size dashboard flow diagram.
When to use it
Use a dashboard when your question covers many outlets or assets at once, such as a trend over time or a comparison of markets or clients. To act on a single outlet, open it in Outlets.
Who uses it
| Role | Typical use |
|---|---|
| Managers and analysts | Review performance across markets, channels and clients. |
| Operations teams | Monitor asset health, availability and delivery compliance. |
Where to find it
Open Dashboard in the menu. Depending on your role and your organization's setup, it can include:
Some dashboards have a help icon (?) next to the title. Select it to open the related page on this site.
How it works
Some dashboards show one client at a time; others can show several.
- Single-client dashboards show the client you have selected. If no client is selected, the dashboard asks you to select one first. See Switch client.
- Multi-client dashboards open with every client you can access selected in the Client filter. Change the filter to compare clients or focus on one.
- Data scope: a dashboard never shows clients you cannot access, regardless of its filters.
Using the screen
- Use the dashboard's filter bar to narrow the data. The filters apply to the charts and tables on that dashboard.
- Each dashboard has its own filters and charts. These can change over time as dashboards improve.
Why you might not see something
- A dashboard is missing from the menu: your role does not include it, or it is not set up for your organization. See Access, roles and permissions.
- A message asks you to select a client: the dashboard shows one client at a time. Select a client, then open the dashboard again.
- You are sent to another screen with a permission message: your role does not include that dashboard.
- The dashboard does not load: try again later. If it keeps failing, contact CoolR Support.
- A client is missing from the Client filter: you do not have access to that client.
Related pages
Last updated: November 12, 2026. Screens and options vary with your role and your organization's setup.